
MEASURING AMERICA:
TEN YEARS AND COUNTING
When Measure of America released its first national report in July 2008, the United States was caught in the Great Recession’s icy grip. The housing, stock, and labor markets had collapsed, and the country was in the midst of the most severe, longest-lasting economic downturn since the Great Depression of the 1930s. Between the start of the Great Recession in December 2007 and its official end in June 2009, the unemployment rate doubled from 5 percent to 10 percent, home prices fell by 30 percent, and stock values plummeted by 57 percent.1 More than half of all American families lost at least 25 percent of their wealth as a result of the economic collapse, and one in four lost at least 75 percent of their wealth. Low-income and minority families were hit the hardest by the housing bust,2 and unemployment skyrocketed among the least educated, reaching 15.8 percent among those without a high school diploma.3
Ten years out from our first report, what can we say about how the Great Recession affected human well-being and shaped people’s choices and opportunities? Which groups of Americans lost their footholds on economic security, and which groups had capabilities like education and family support that allowed them to weather the crisis? Whose fortunes have rebounded, whose have stalled, and whose have taken off?
Unlike economic indicators like gross domestic product (GDP), updated quarterly, and stock prices, updated moment by moment, data on human well-being are typically released just once per year, almost always one, two, or more years after they were collected. Thus the data in our 2008 report were collected in 2005, and the data in this report are from 2016. This time period—starting in 2005, when the economy was booming; ending in 2016, when the economy had recovered; and encompassing the painful recessionary years in between—was a remarkable one in modern US history. It provides the backdrop for our exploration of a decade of human development progress and setbacks.
10 YEARS
TIMELINE

ABOUT
HUMAN DEVELOPMENT

ABOUT HUMAN DEVELOPMENT
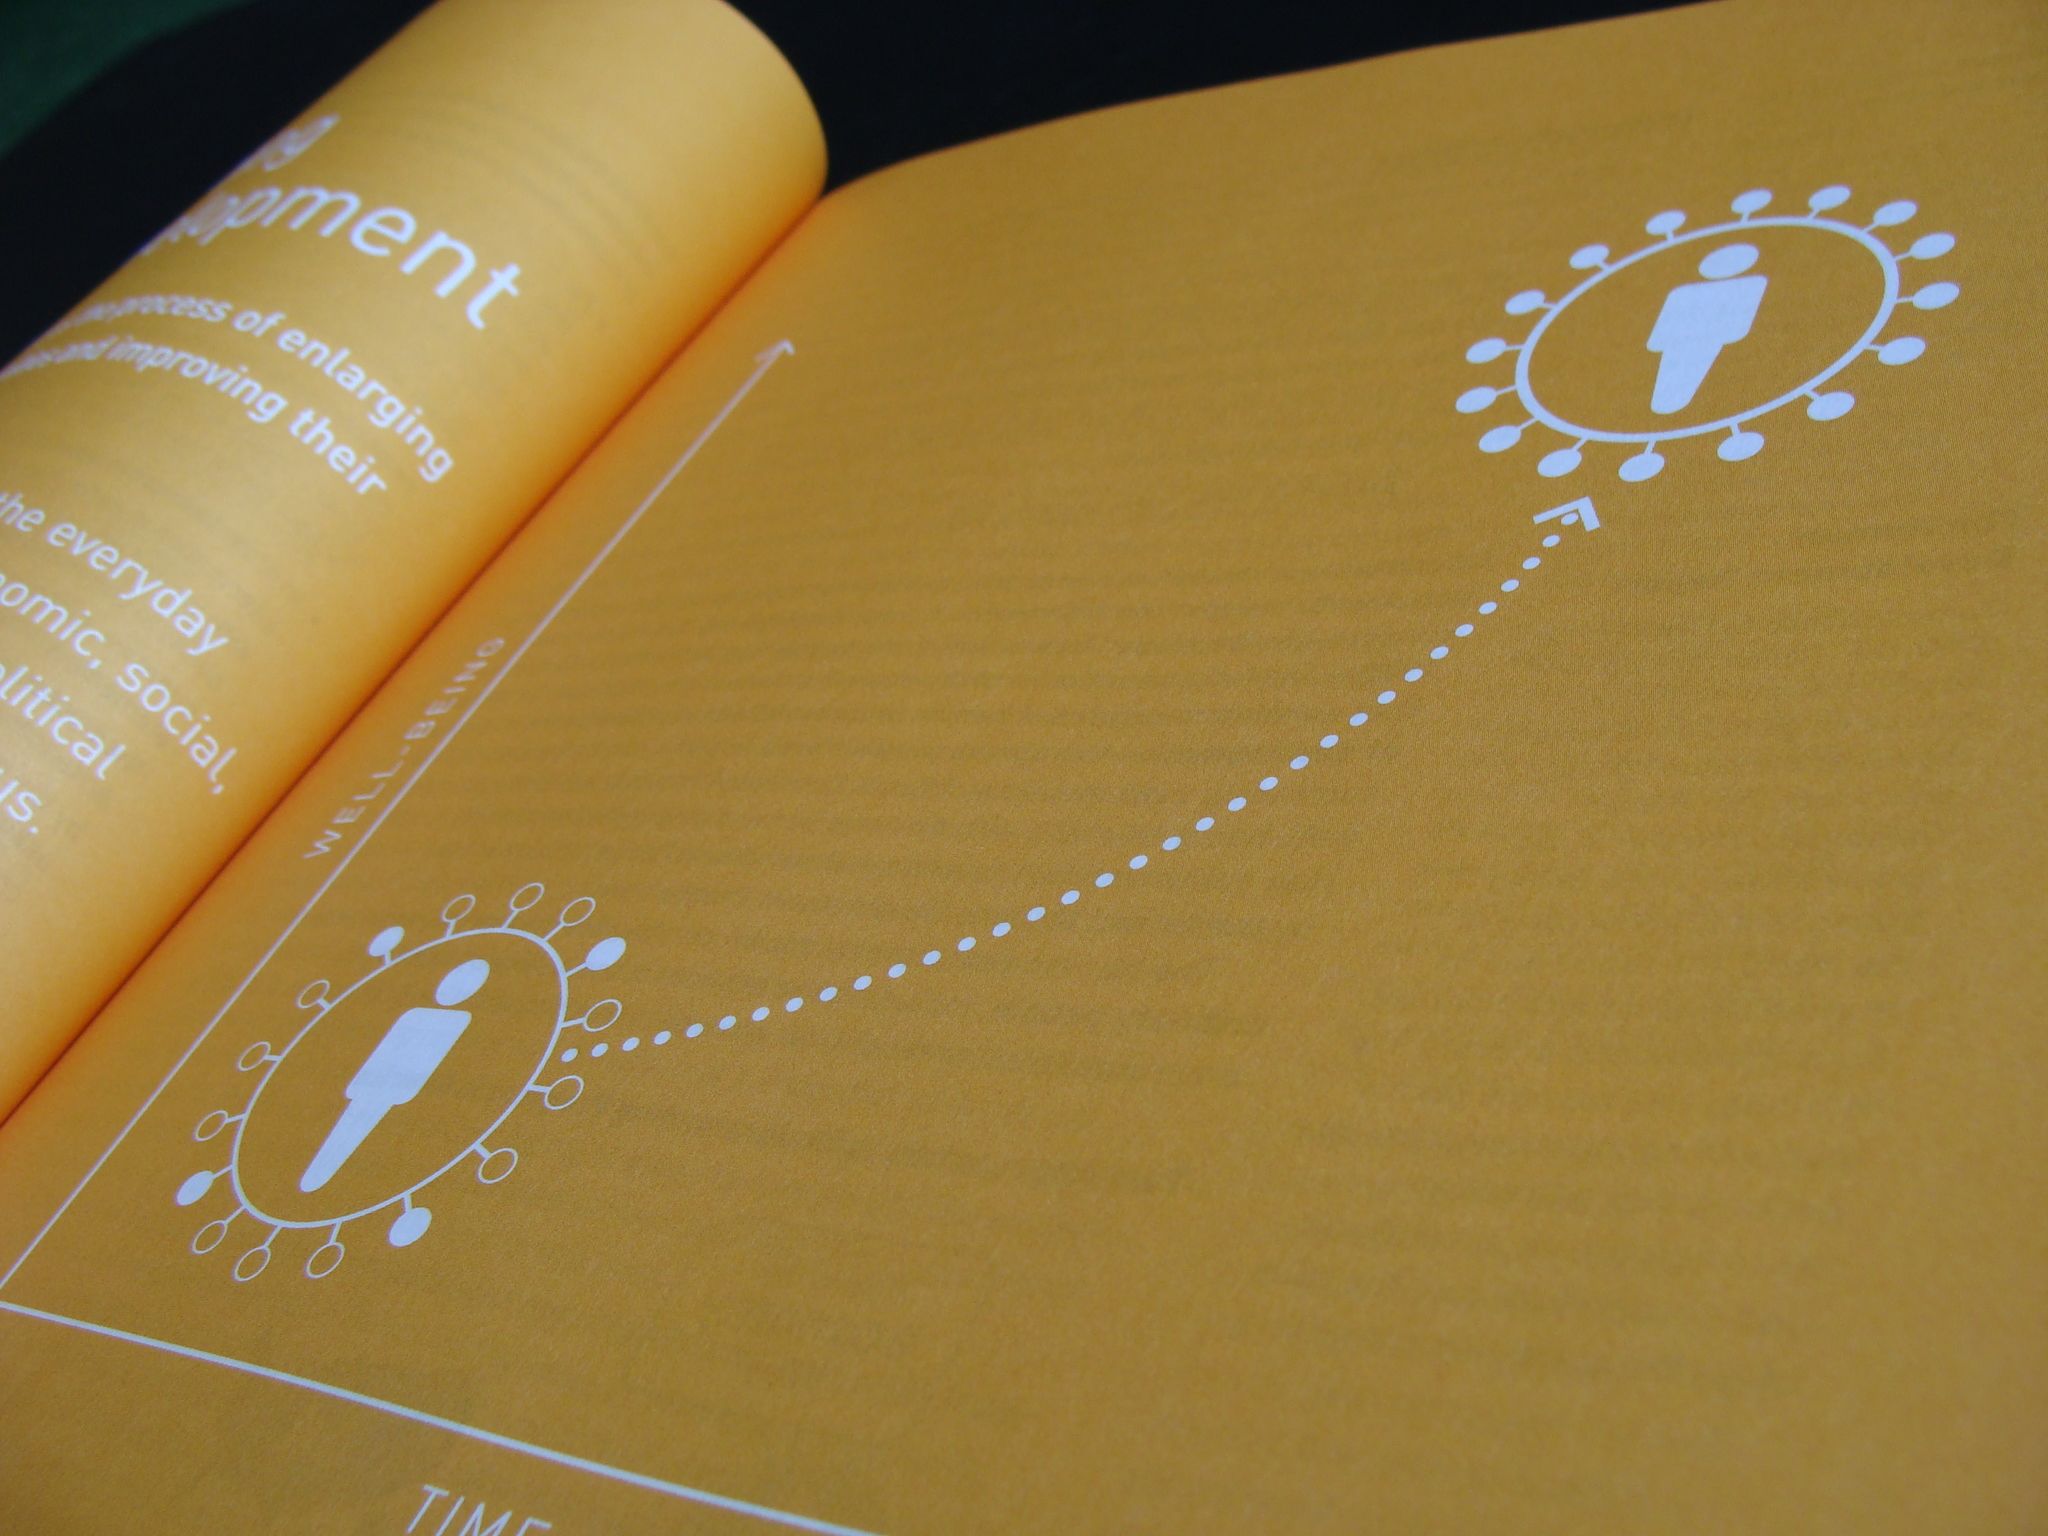
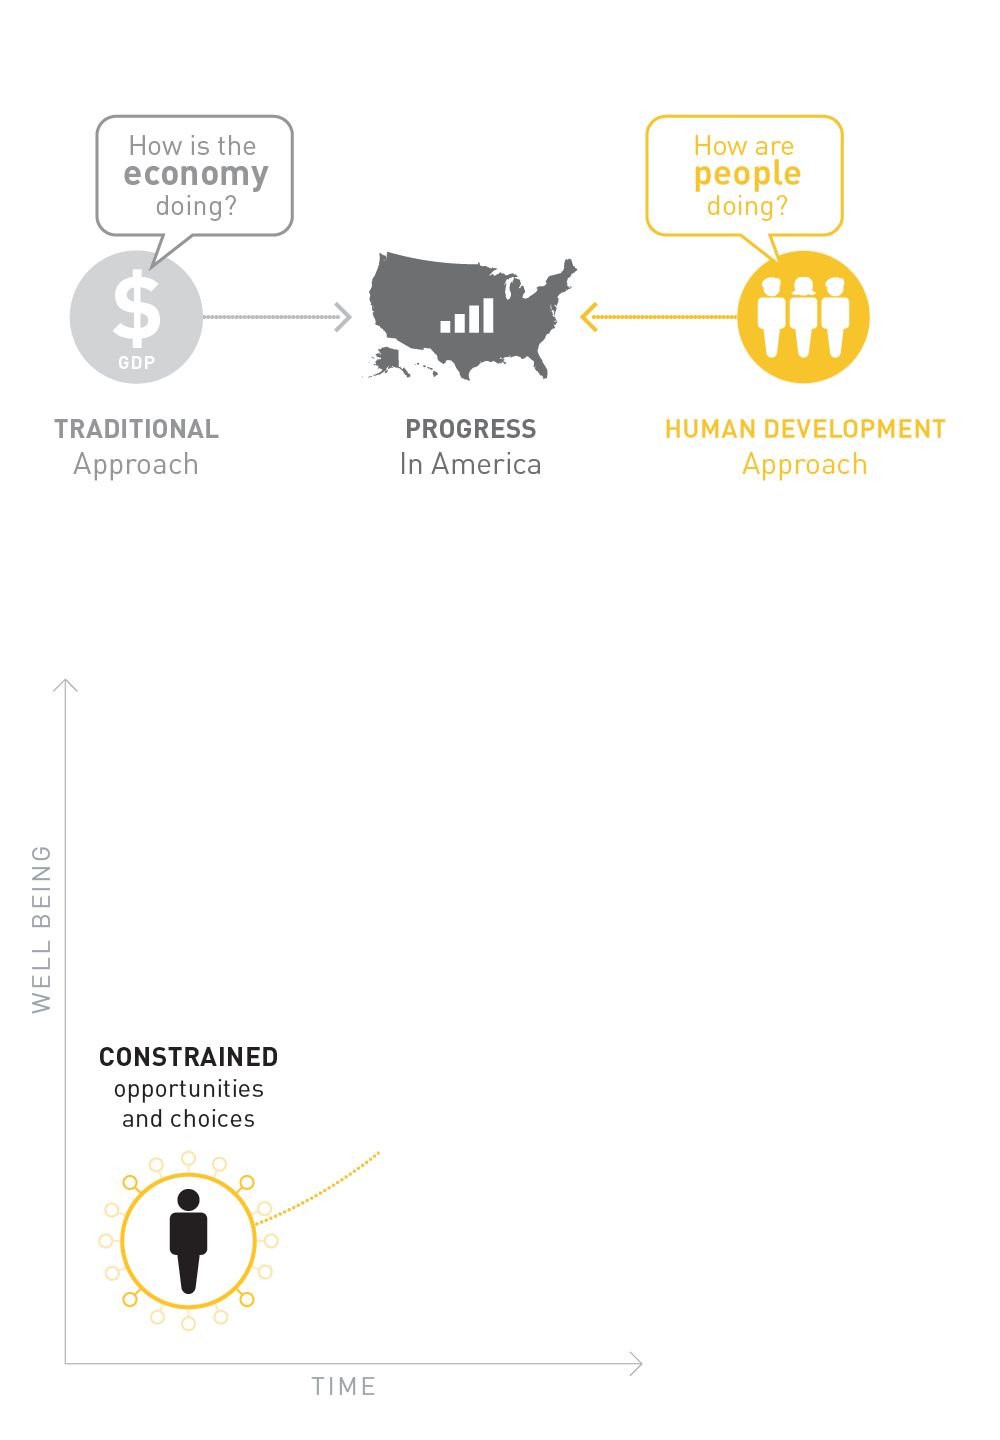
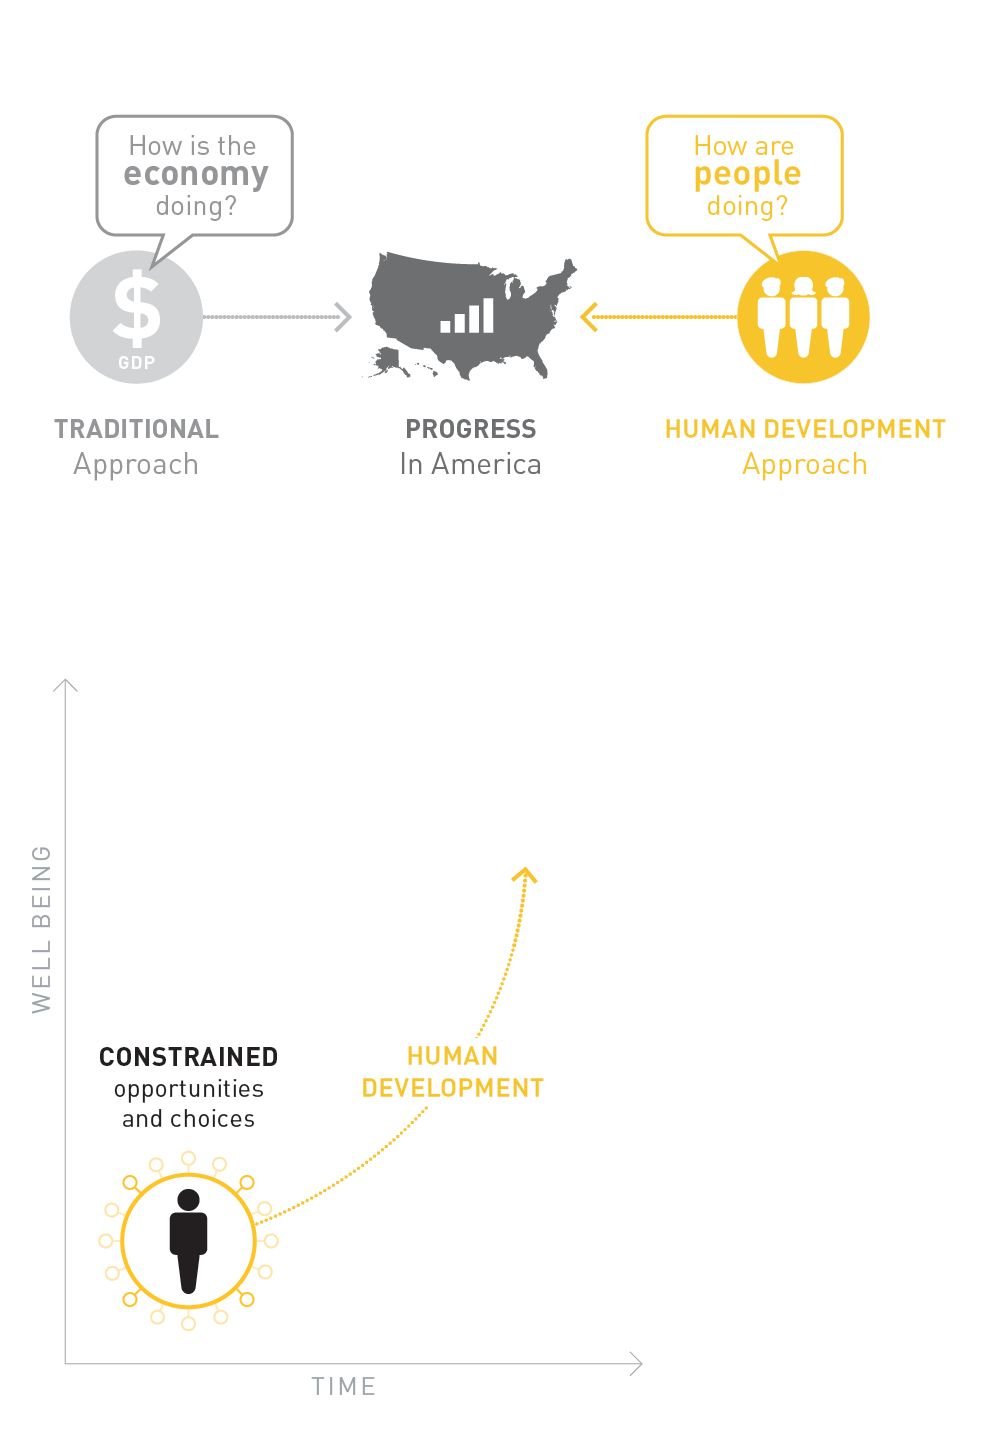
The idea of human development is the brainchild of the late economist Dr. Mahbub ul Haq. Through his work at the World Bank in the 1970s, and later as minister of finance in his home country, Pakistan, Dr. Haq came to believe that common measures of progress failed to account for the true purpose of development: to improve people’s lives. He argued that GDP was a particularly inadequate gauge of well-being. To explain why, Dr. Haq often cited the example of Vietnam and Pakistan. In the late 1980s, the two countries had the same GDP per capita—around $2,000 per year—but Vietnamese lived a full eight years longer than Pakistanis and were twice as likely to be able to read.
In other words, money alone did not tell the whole story; the same income bought two dramatically different levels of well-being. Working with Harvard professor and Nobel laureate Amartya Sen and other gifted economists, Dr. Haq devised not only the idea of human development but also a way to measure it: the Human Development Index. He introduced this new way of thinking about and measuring progress in the first Human Development Report, which was released in 1990 under the auspices of the United Nations Development Program. The report ranked all the world’s countries not by the size of their economies but rather by the well-being of their people.
Since then, the annual Human Development Report has served as the global gold standard for understanding and tracking human well-being. In addition, more than 160 countries have produced national human development reports over the last quarter century. Measure of America adapted the approach and index, which were designed with developing countries in mind, to the context of an affluent democracy, releasing the first-ever American Human Development Report a decade ago in 2008.

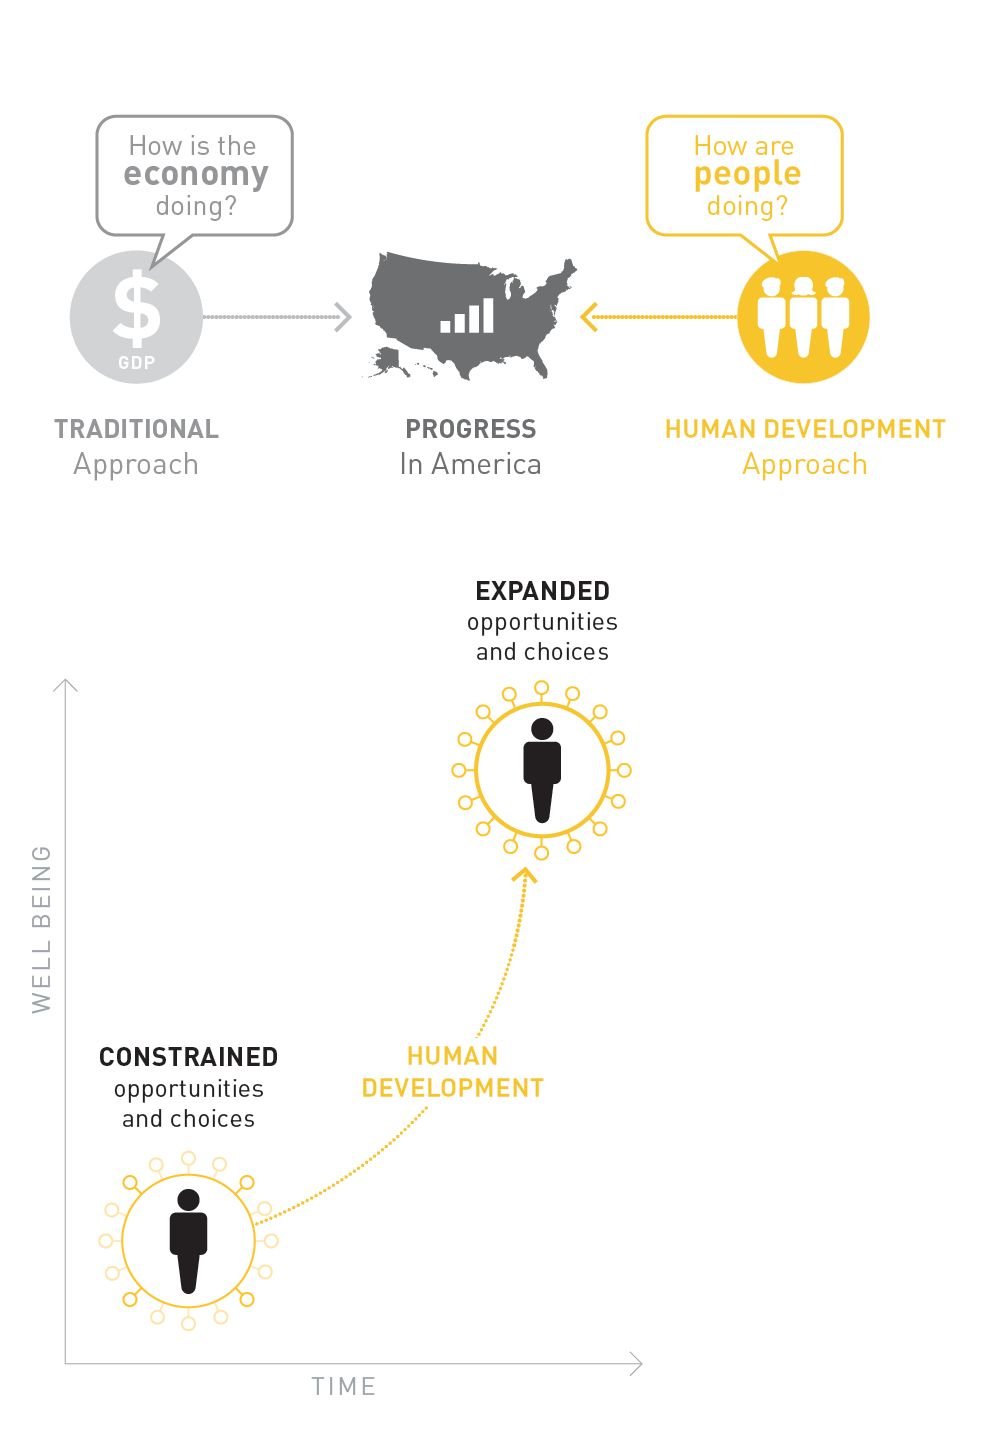
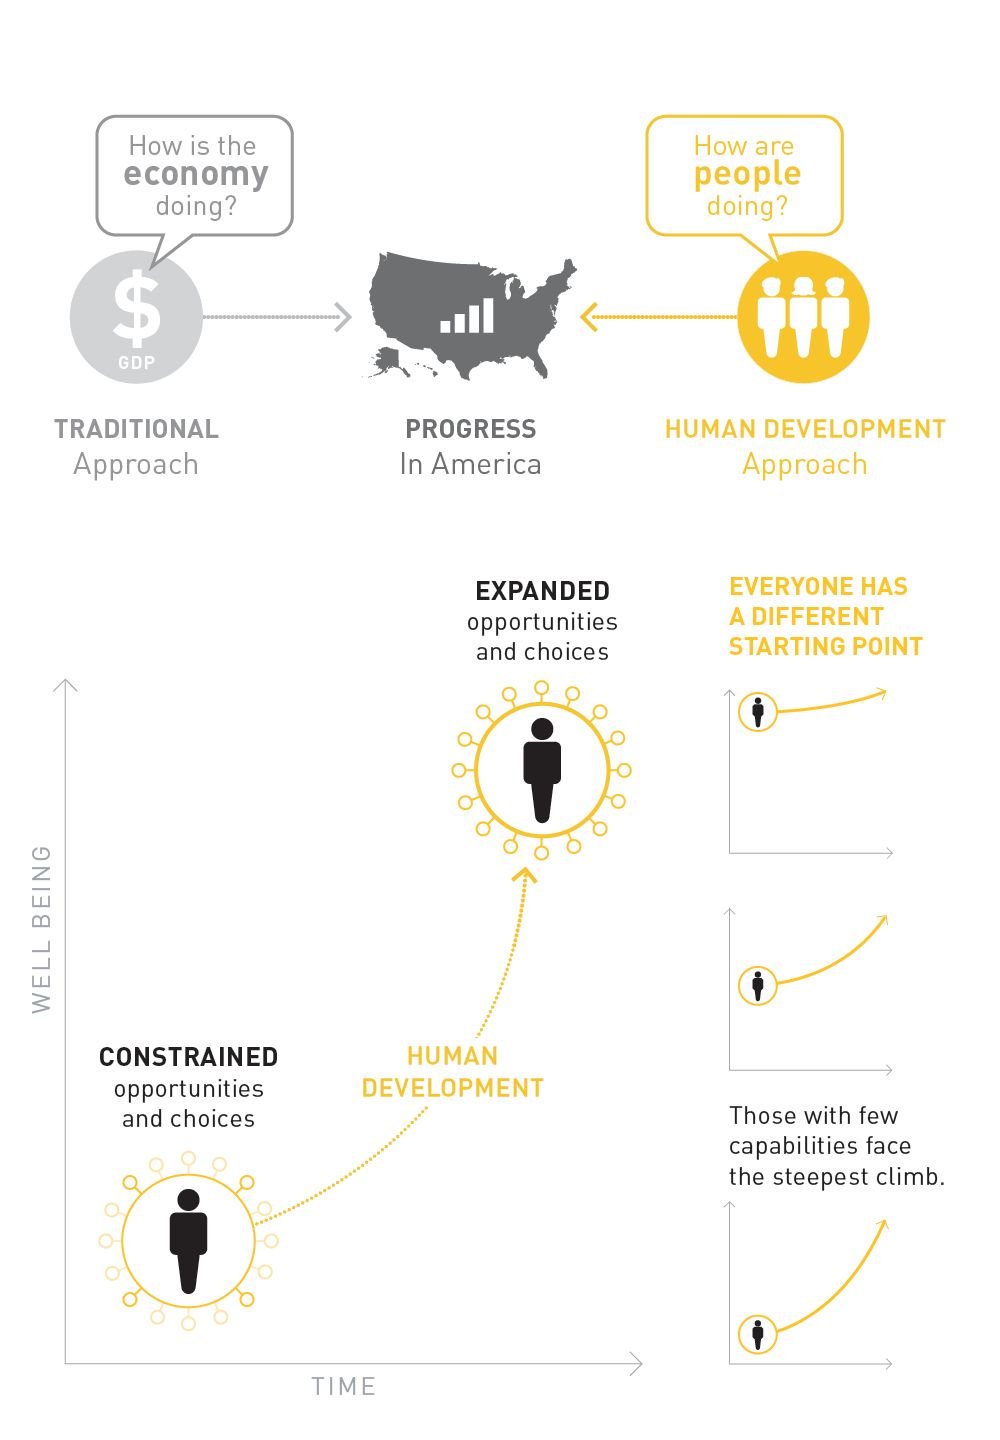
The human development approach rests on a sturdy conceptual framework: Amartya Sen’s seminal work on capabilities. Capabilities can be understood as a person’s “tool kit” for living a freely chosen life of value. Capabilities shape the real possibilities open to people, govern the freedom they have to lead the kind of lives they want to live, and ultimately determine what a person can do and become. We tend to think of capabilities as an individual’s skills and talents. In the human development approach, the word’s meaning is far more expansive. Valued capabilities include good health, access to knowledge, sufficient income, physical safety, religious freedom, political participation, love and friendship, societal respect, equality under the law, social inclusion, agency, the ability to influence decisions that affect one’s life, and more. Some capabilities are built through one’s own efforts, such as working hard in school, eating a healthy diet, and getting physical exercise; others are the result of the conditions and institutions around a person, such as having access to high-quality schools, stores that sell nutritious food, and parks in which to safely walk or jog; many result from the interplay between the two. Some capabilities are bestowed on people through an accident of birth: having rich parents or well-connected, powerful relatives. Others are impeded by neglect or family violence. Capabilities can stem from legally protected rights, such as freedom of conscience or assembly, or freedom from arbitrary detention. Capabilities can be built or eroded by the state of the economy, the state of the natural environment, the state of public discourse, or the state of our democracy.
Trying to measure all the facets of this expansive concept would be a fool’s errand. Thus, the UN Human Development Index as well as the adapted American Human Development Index measure just three fundamental human development dimensions: a long and healthy life, access to knowledge, and a decent standard of living. Why only three areas, and why these three in particular? People around the world view them as core building blocks of a life of value, freedom, and dignity; healthy lives, good educations, and decent wages are not controversial aims. In addition, these foundational capabilities make possible other capabilities, such as adequate housing in safe neighborhoods. From a practical perspective, these are areas that one can measure comparatively easily; reliable and regularly collected proxy indicators are available for each. From both a methodological and a communications point of view, indexes with large numbers of indicators can be tricky. Using many indicators can lead to counting the same phenomenon two or three times, to confusing results, and to a false equivalence between fundamental and derivative issues. Indexes that include scores of indicators can be difficult to explain and understand, diluting their advocacy power.
It is important, however, to be realistic about the limitations of a parsimonious index like this one. It doesn’t include environmental indicators or indicators amenable to very short-term change, for example. To address these limitations, this report is accompanied by an online mapping tool with scores of well-being indicators available by place and demographic group, including a Sustainable Development Goals dashboard that features indicators across a wide range of sectors. The Human Development Index is not the end of a discussion on well-being; it is the start.


BUILDING THE AMERICAN HUMAN DEVELOPMENT INDEX
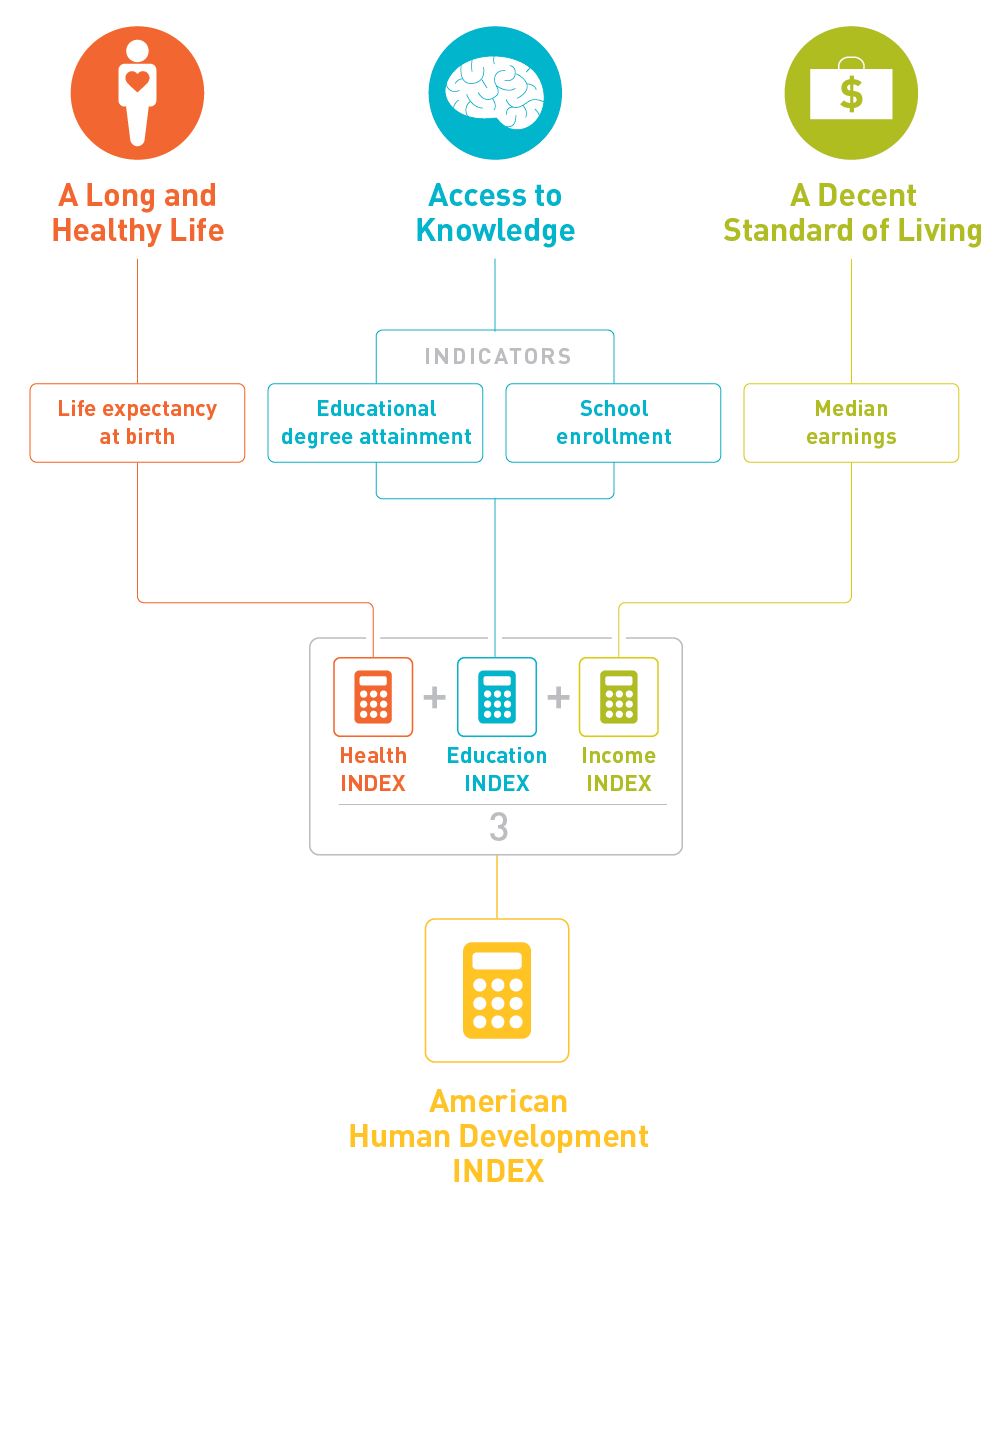
The American Human Development Index is comprised of the following indicators:
A Long and Healthy Life is measured using life expectancy at birth.
Measure of America calculates life expectancy at birth using mortality data from the Centers for Disease Control / National Center for Health Statistics and population data from the American Community Survey.
Access to Knowledge is measured using two indicators: school enrollment for the population 3 to 24 years of age and educational degree attainment for those 25 and older.
A one-third weight is applied to the enrollment indicator and a two-thirds weight to the degree attainment indicator. Both are from the US Census Bureau’s American Community Survey.
A Decent Standard of Living is measured using median earnings of all full- and part-time workers ages 16 and older from the same American Community Survey.
The three components are weighted equally on the premise that each is equally important for human well-being. In broad terms, the first steps for calculating the index are to compile or calculate the four indicators that comprise it: life expectancy, school enrollment, educational degree attainment, and median personal earnings. Because these indicators use different scales (years, dollars, percentages), they must be put on a common scale so they can be combined. Three subindices, one for each of the three dimensions that makeup the index—health, education, and earnings—are created on a scale of 0 to 10. They are then added together and divided by three to yield the American Human Development Index value. (A description of how the index is calculated is contained in the Methodological Note, which can be found under Resources.) Measure of America calculates index scores for men and women; for racial and ethnic groups; and for various geographies, including states, congressional districts, metro areas, counties, municipalities, and census tracts. This report presents scores by gender, by race and ethnicity, and by state as well as trends over time.


10 YEARS
HUMAN DEVELOPMENT TRENDS


WHAT THE HDI REVEALS
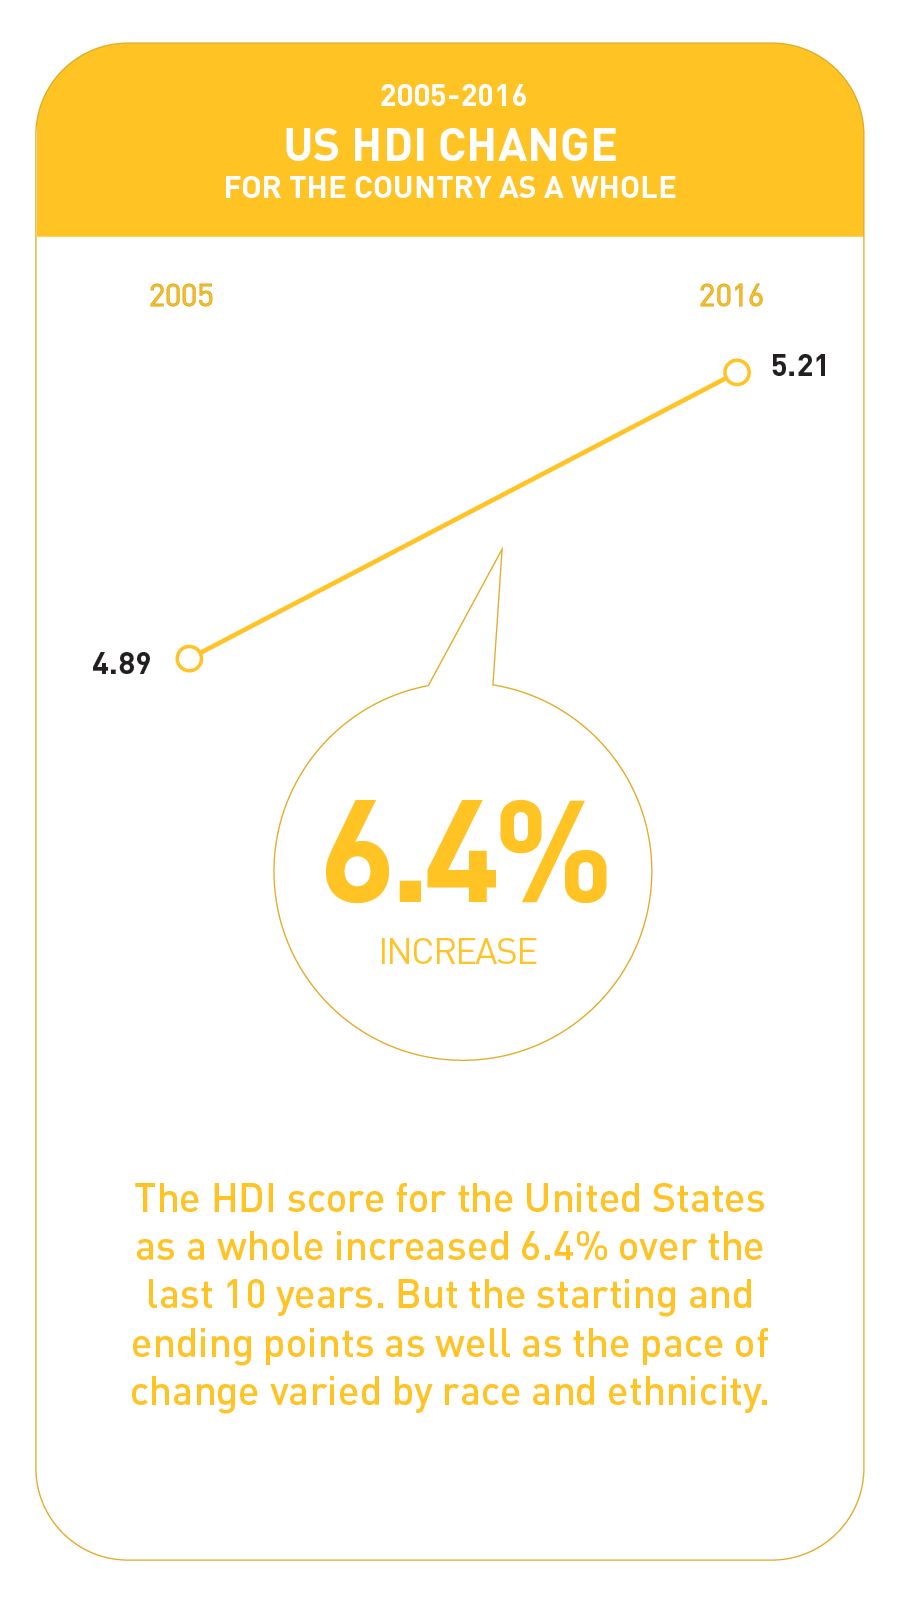
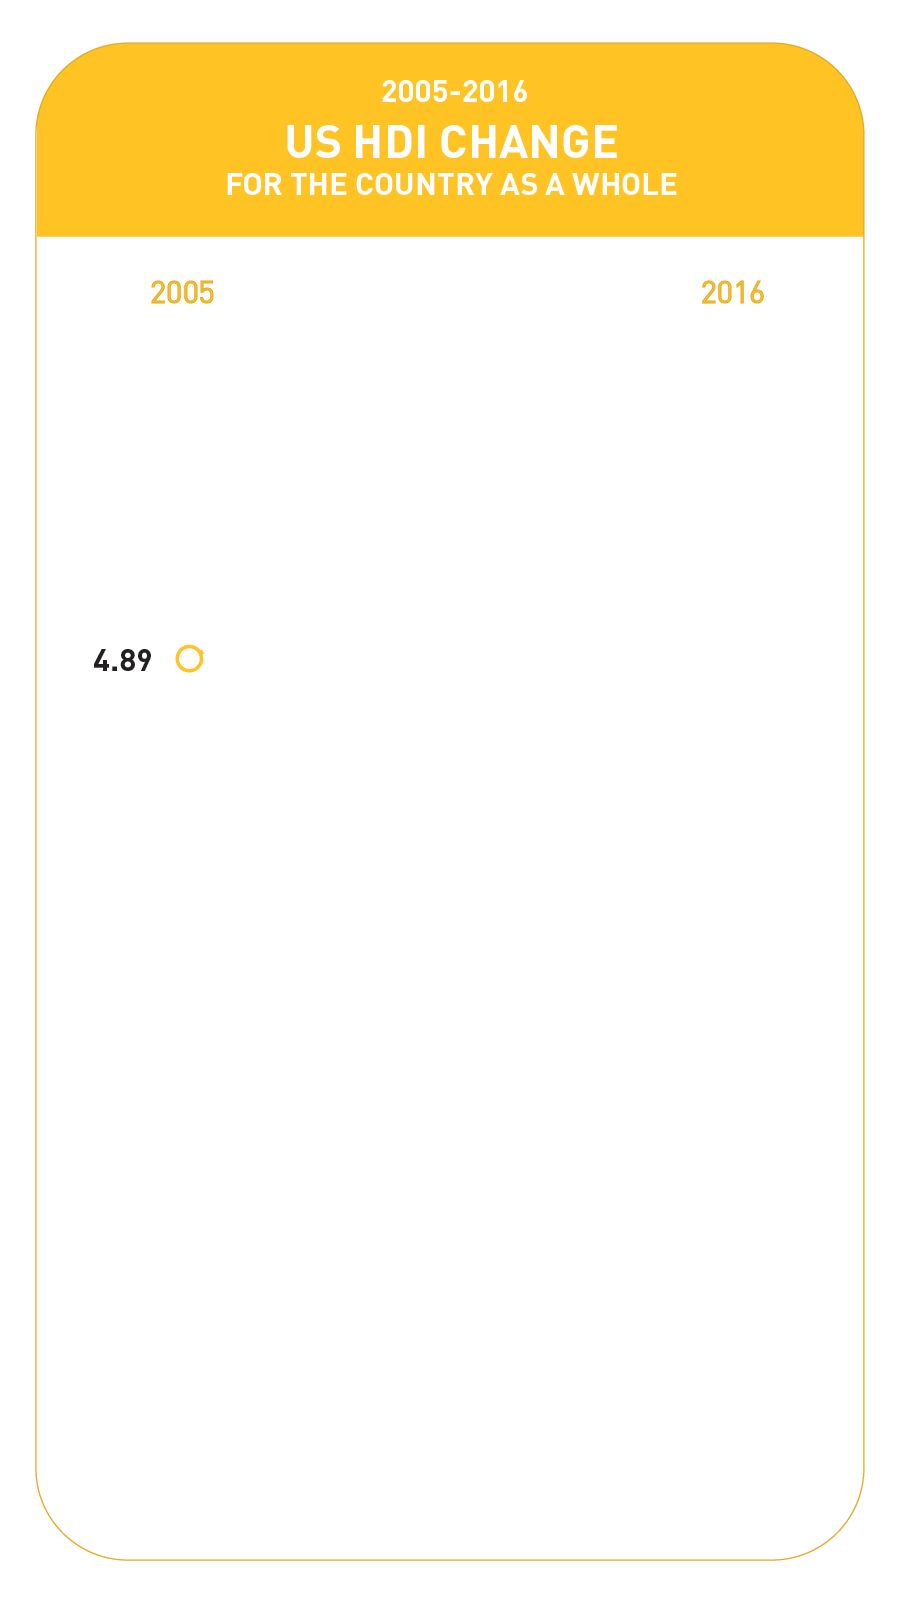
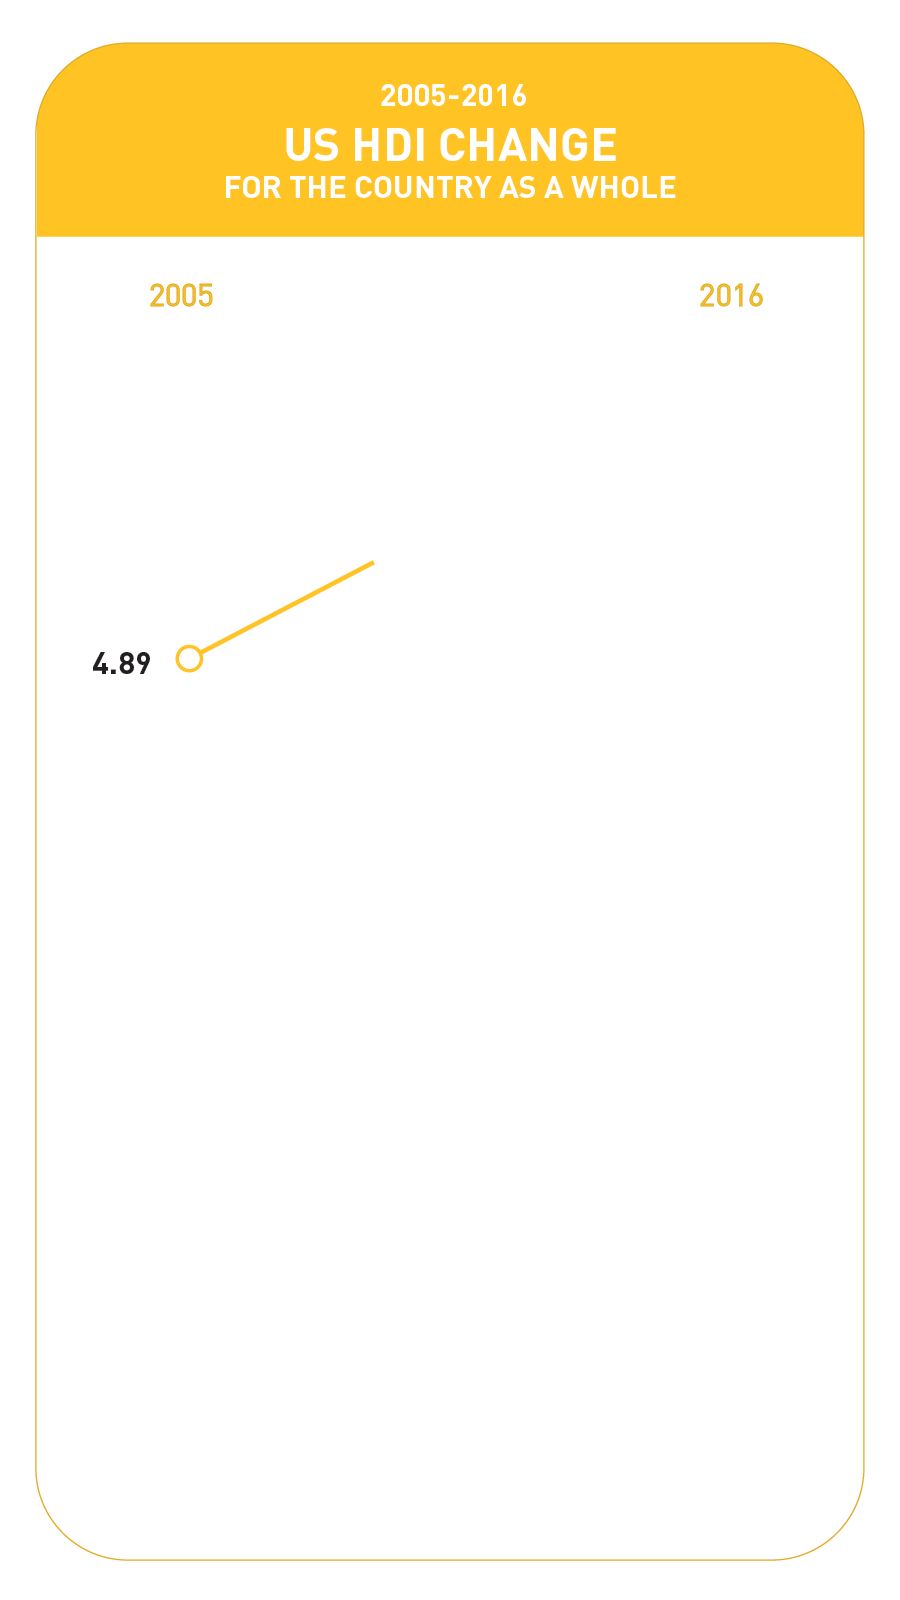
The American Human Development (HD) Index score for the United States as a whole is 5.21, an increase of 6.4 percent over its 2005 score of 4.89. But the starting and ending points as well as the pace of change vary sharply among the country’s racial and ethnic groups.
In 2005, American men scored higher than women, 4.94 compared to 4.75. Today, women edge out men slightly, scoring 5.23 to men’s 5.20; women have better health and educational outcomes, but men earn more.
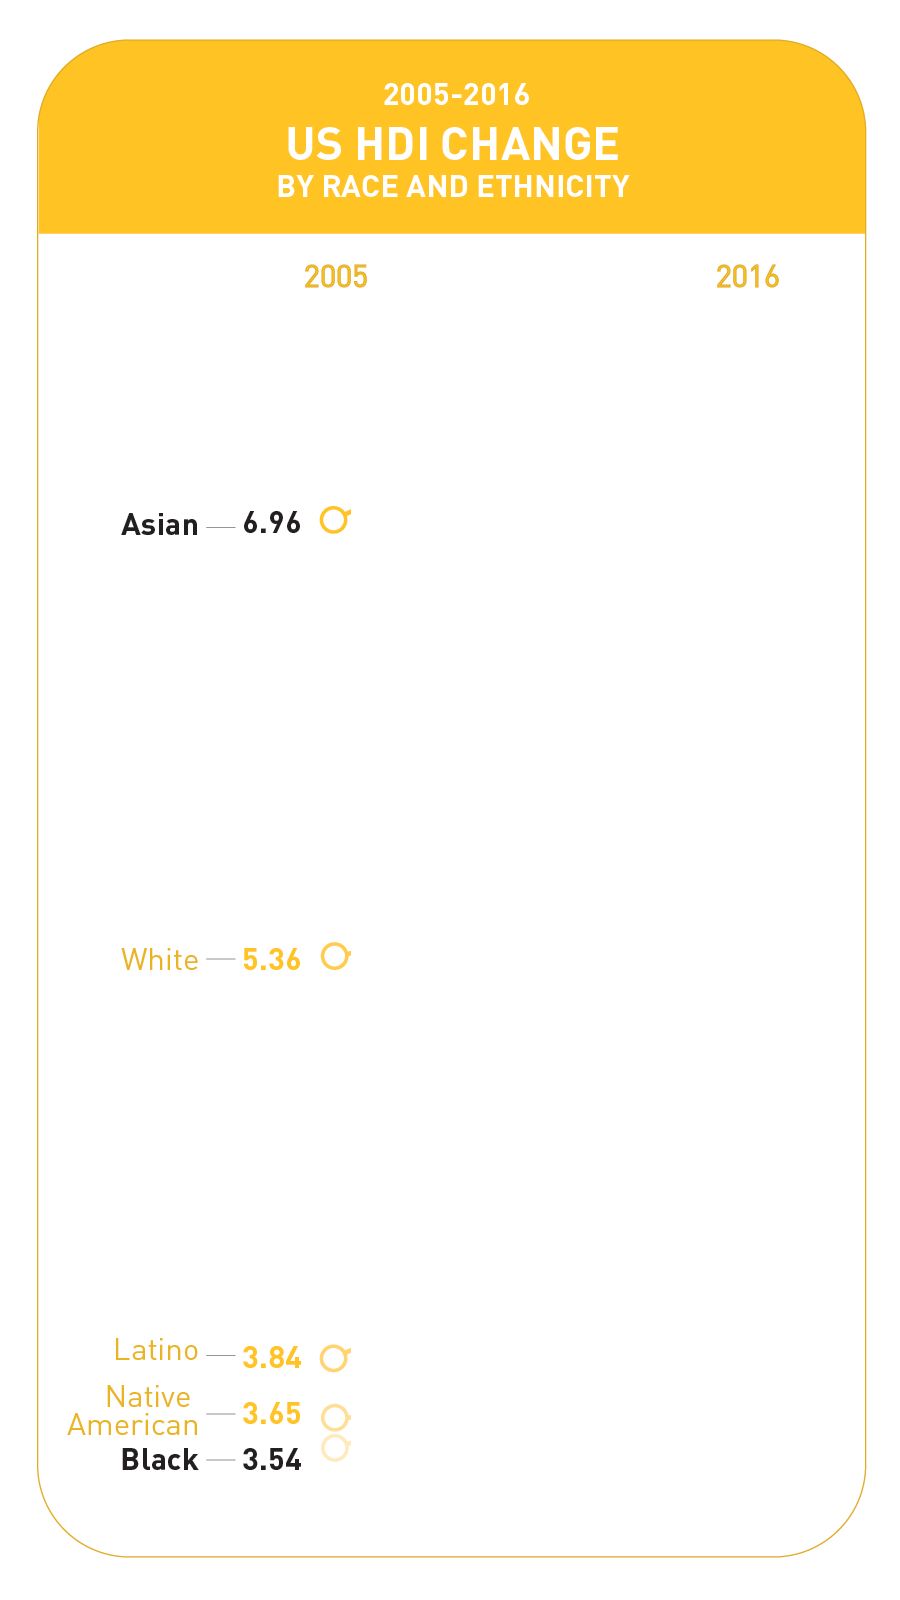
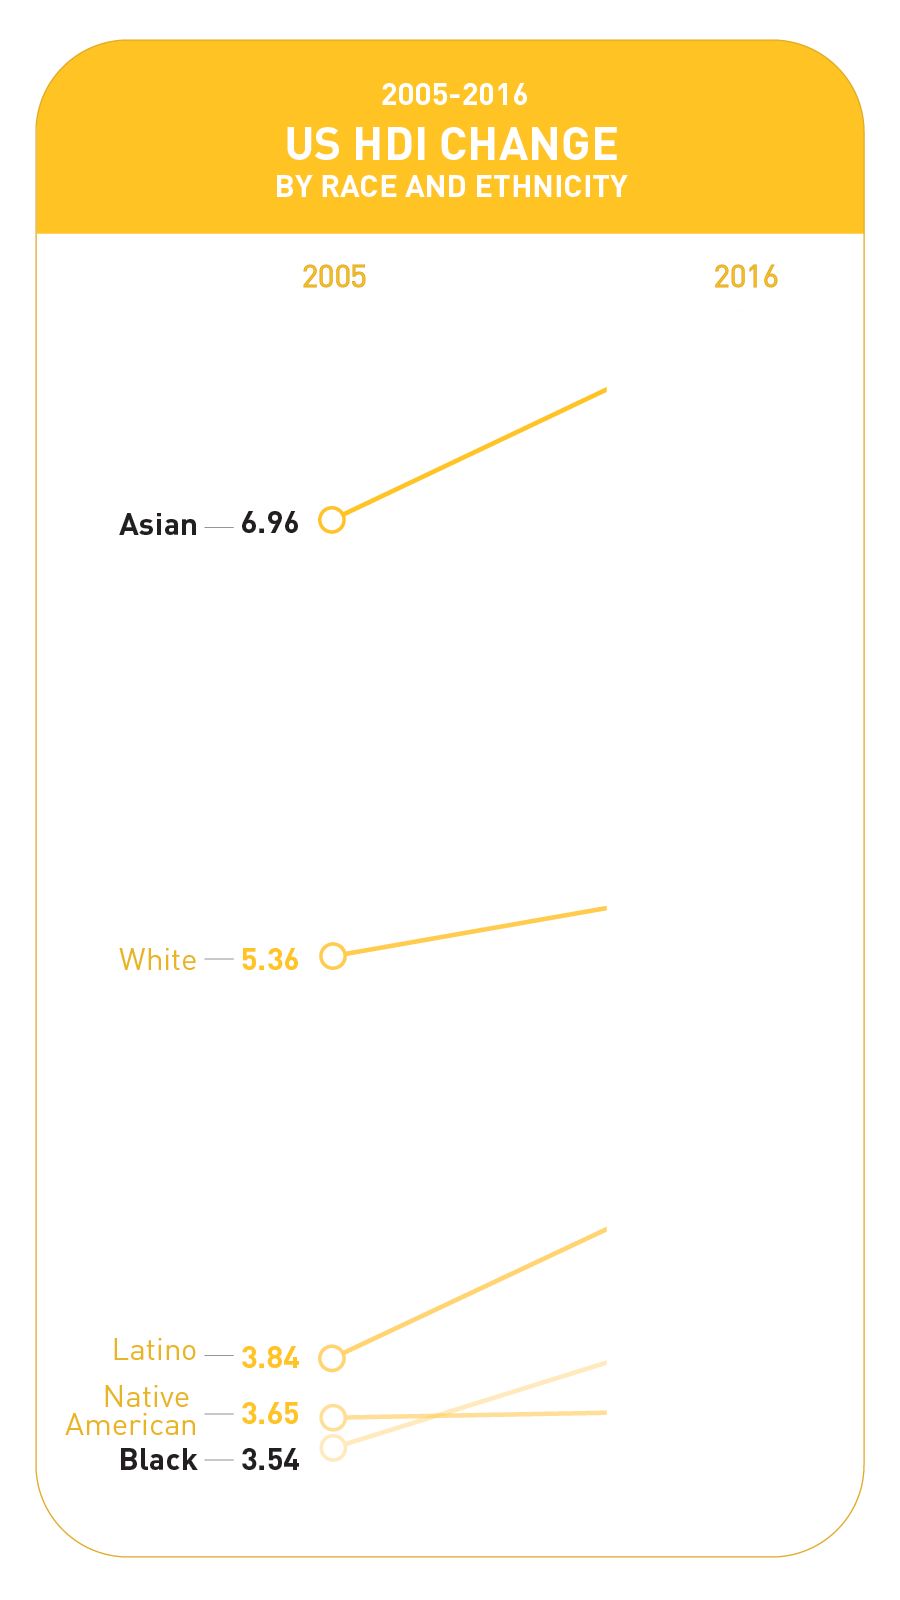
The well-being ranking by race and ethnicity is as follows: Asian residents have the highest score, followed by whites, Latinos, blacks, and Native Americans. In 2005, black residents had the lowest score; today, Native Americans do.
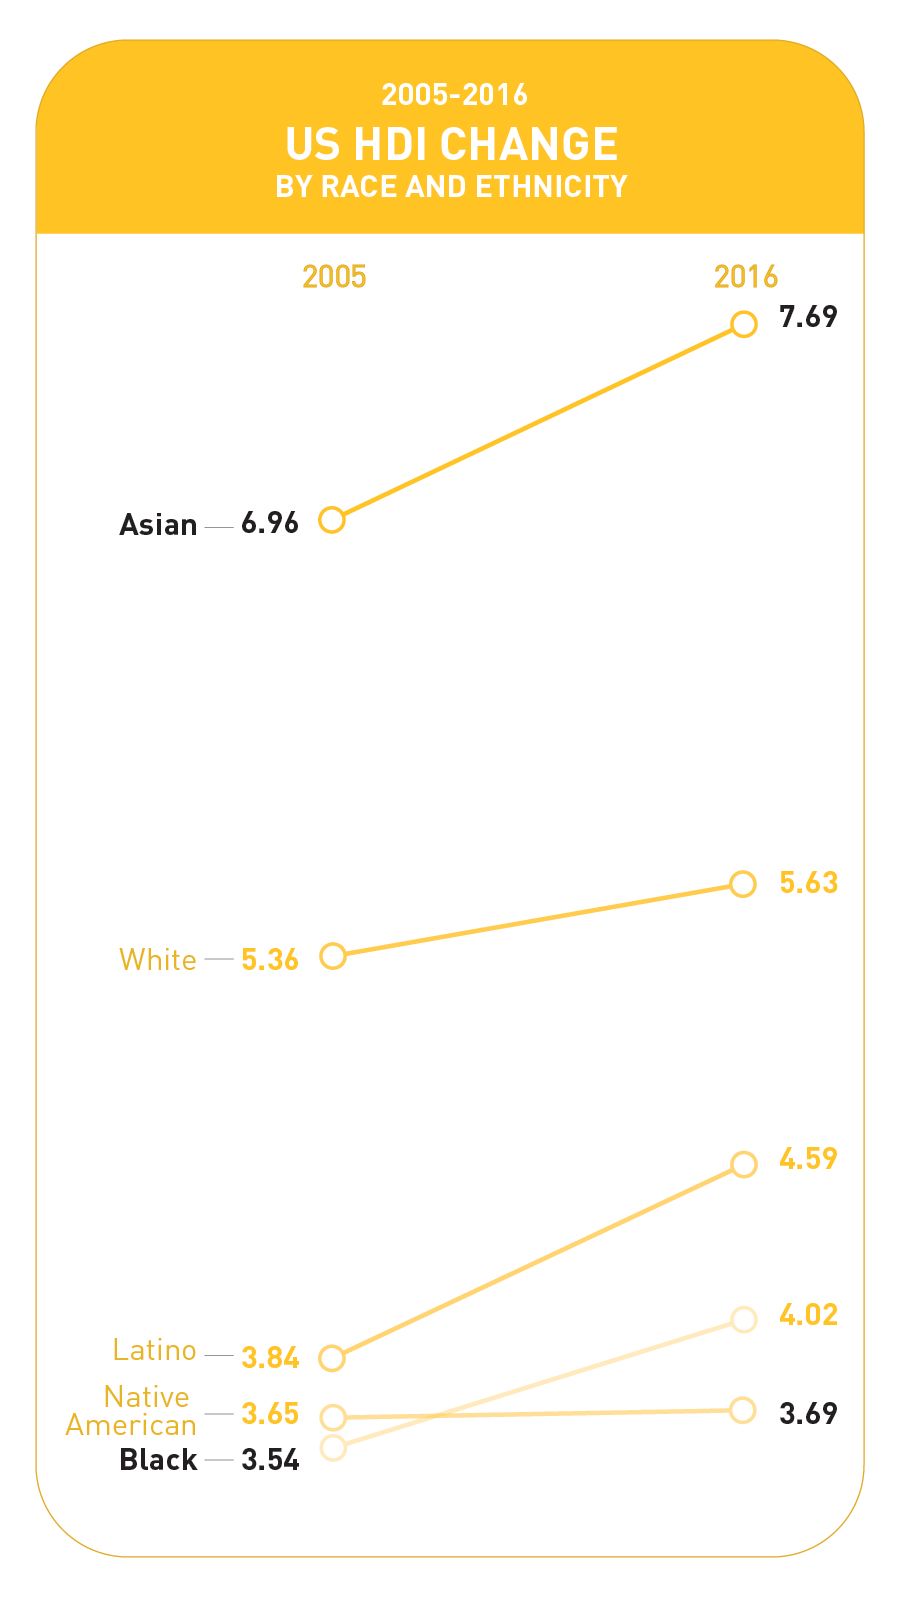
Asian residents, the top-scoring group in 2005, also have the highest well-being score today, 7.69. Asian men top the chart with a score of 7.82, followed by Asian women, with a score of 7.31. The Asian score improved by more than 10 percent over the last decade, outpacing the improvements in the national score. Although data limitations prevent us from calculating life expectancy for Asian subgroups and thus make it impossible to create HD Index scores for them, both education and earnings data for many subgroups are available from the American Community Survey. Earnings and educational attainment data for Asian subgroups and the methodological note, which describes the racial and ethnic categories used in this report, can be found under Resources.
White residents have the second-highest score, 5.63. Whites also had the second-highest score in 2005. White men score 5.67, white women, 5.58. Although white men still outscore their female counterparts due to the former’s much higher wages, white women’s well-being has improved at a quicker clip over the past decade. White women’s score improved by 10.5 percent, but white men’s score improved by just 3.2 percent—the smallest improvement of any group except for Native American men, whose score actually decreased. So while white men still rank third on the well-being chart—after Asian men and Asian women—the gaps between them and white women, black men, black women, Latino men, Latina women, and Native American women have narrowed since 2005. Although white men still have higher levels of well-being and, particularly, higher incomes than most other groups, it is possible that the narrowing distance between them and both white women and people of color are contributing to a sense that they are losing ground.
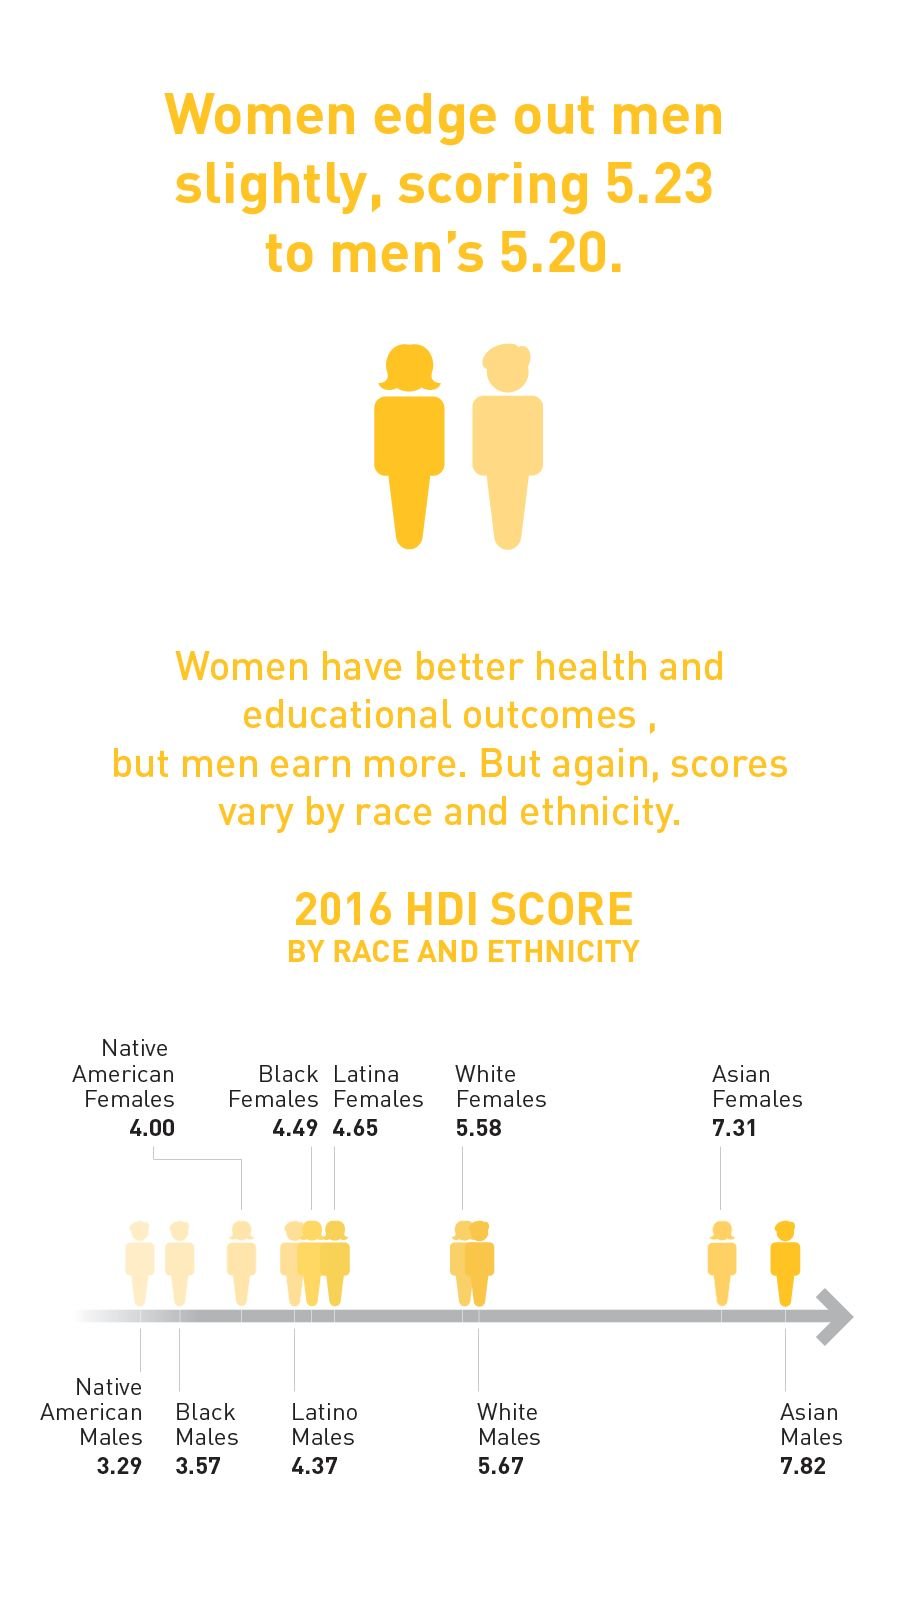
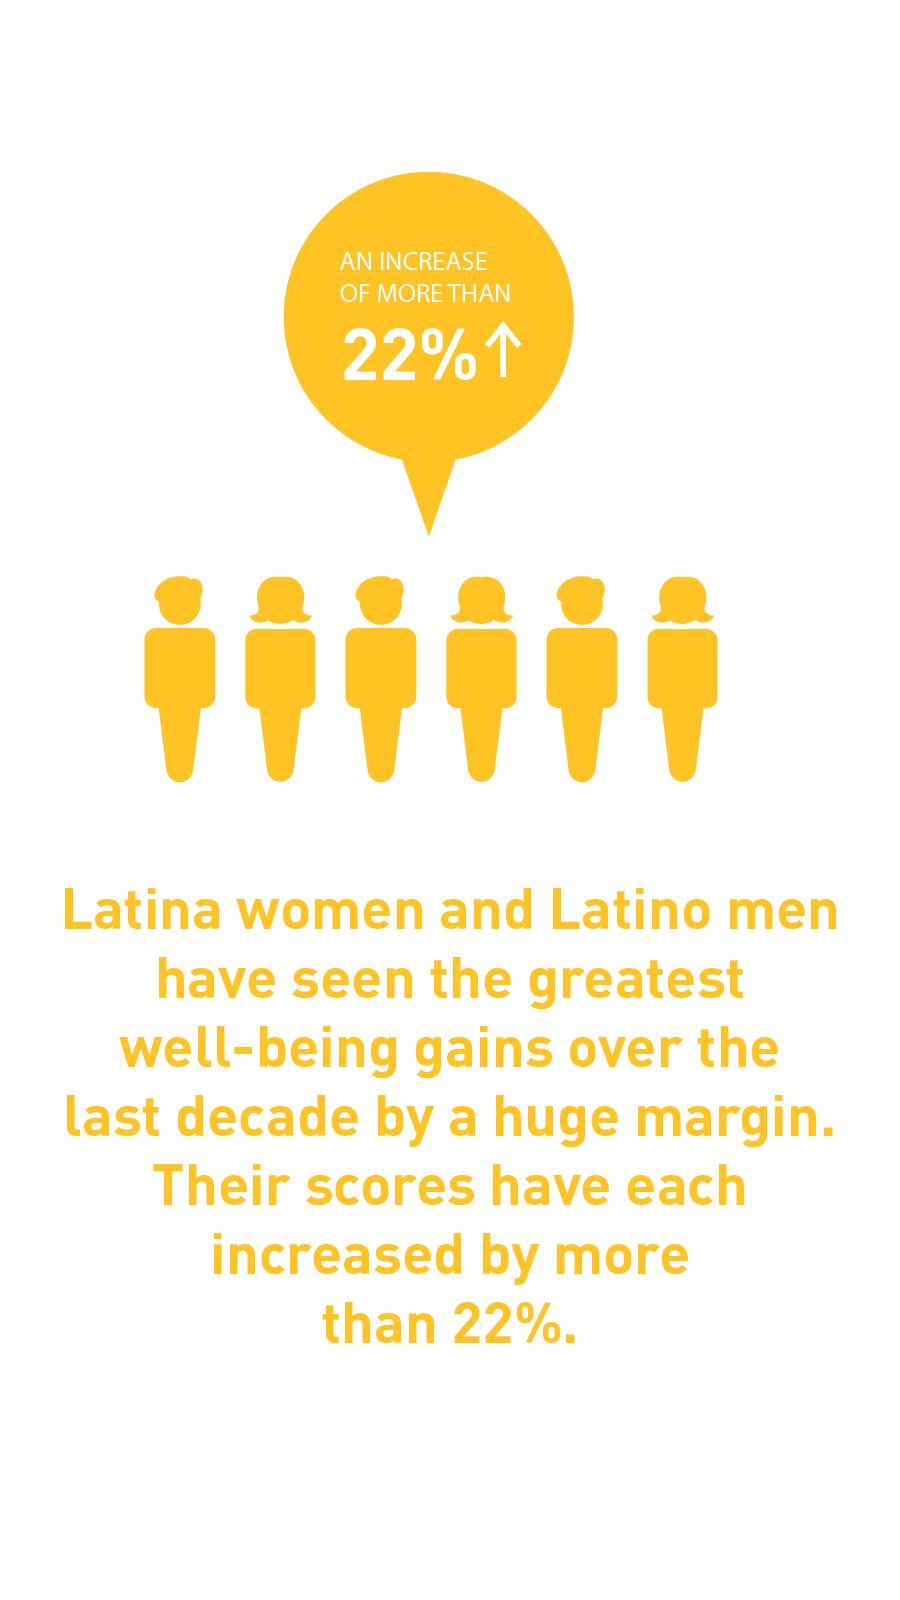
Latinos rank third overall, with a score of 4.59. Latinas have a higher score than their male counterparts, 4.65 compared to 4.37. Latina women and Latino men have seen the greatest well-being gains over the last decade by a huge margin. Though still below the national average, their scores have each increased by more than 22 percent—more than three times the national rate of change. Although data limitations prevent us from calculating life expectancy for Latino subgroups and thus make it impossible to create HD Index scores for them, education and earnings data are available for some subgroups from the American Community Survey. Earnings and educational attainment data for Latino subgroups can be found under Resources.
Black Americans rank fourth on the national list with a score of 4.02. The well-being scores of black women and men diverge more than those of any other racial or ethnic group; black women score 4.49 and black men score 3.57. Black women have seen some of the largest well-being gains over the past decade. Their score has increased by 17.5 percent since 2005; only Latinos made faster progress. Black men’s score has also improved, but by much less, 7.1 percent.
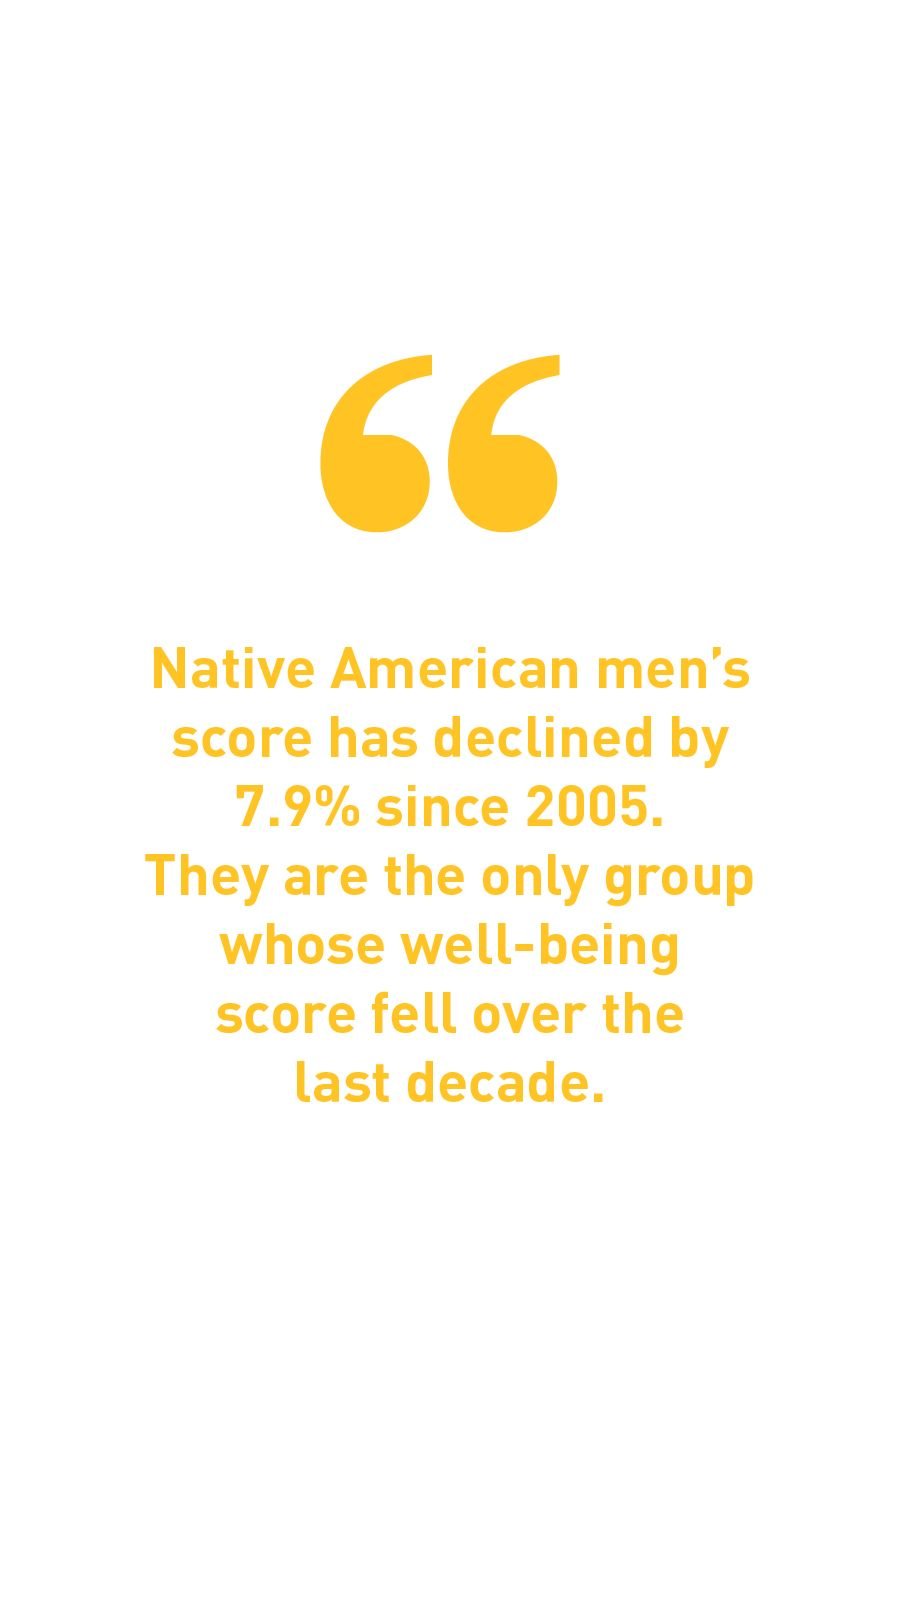
Native Americans have the lowest score of the country’s major racial and ethnic groups, 3.69. As with black residents, Native Americans see a sharp gender divide. Native American women score 4.00, Native American men, 3.29. While women’s score has increased by 9.5 percent over the last decade, outpacing national improvements, Native American men’s score has actually declined by 7.8 percent since 2005. They are the only group whose well-being score fell over the last decade.
Native American men (3.29) and black men (3.57) have well-being scores similar to the US national score in the late 1960s.
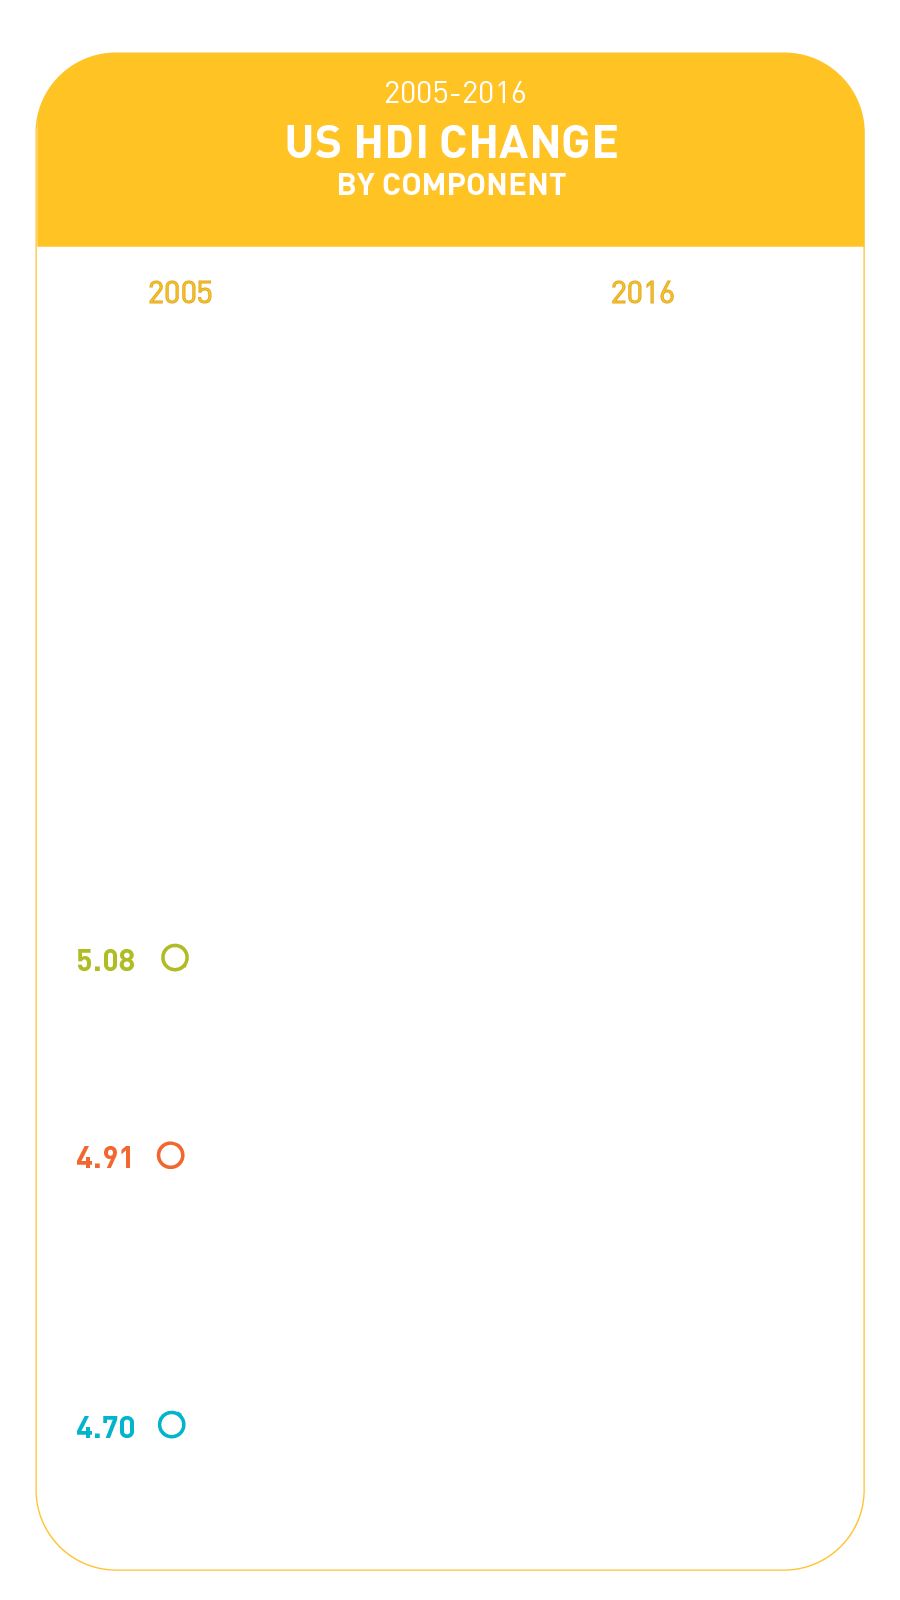
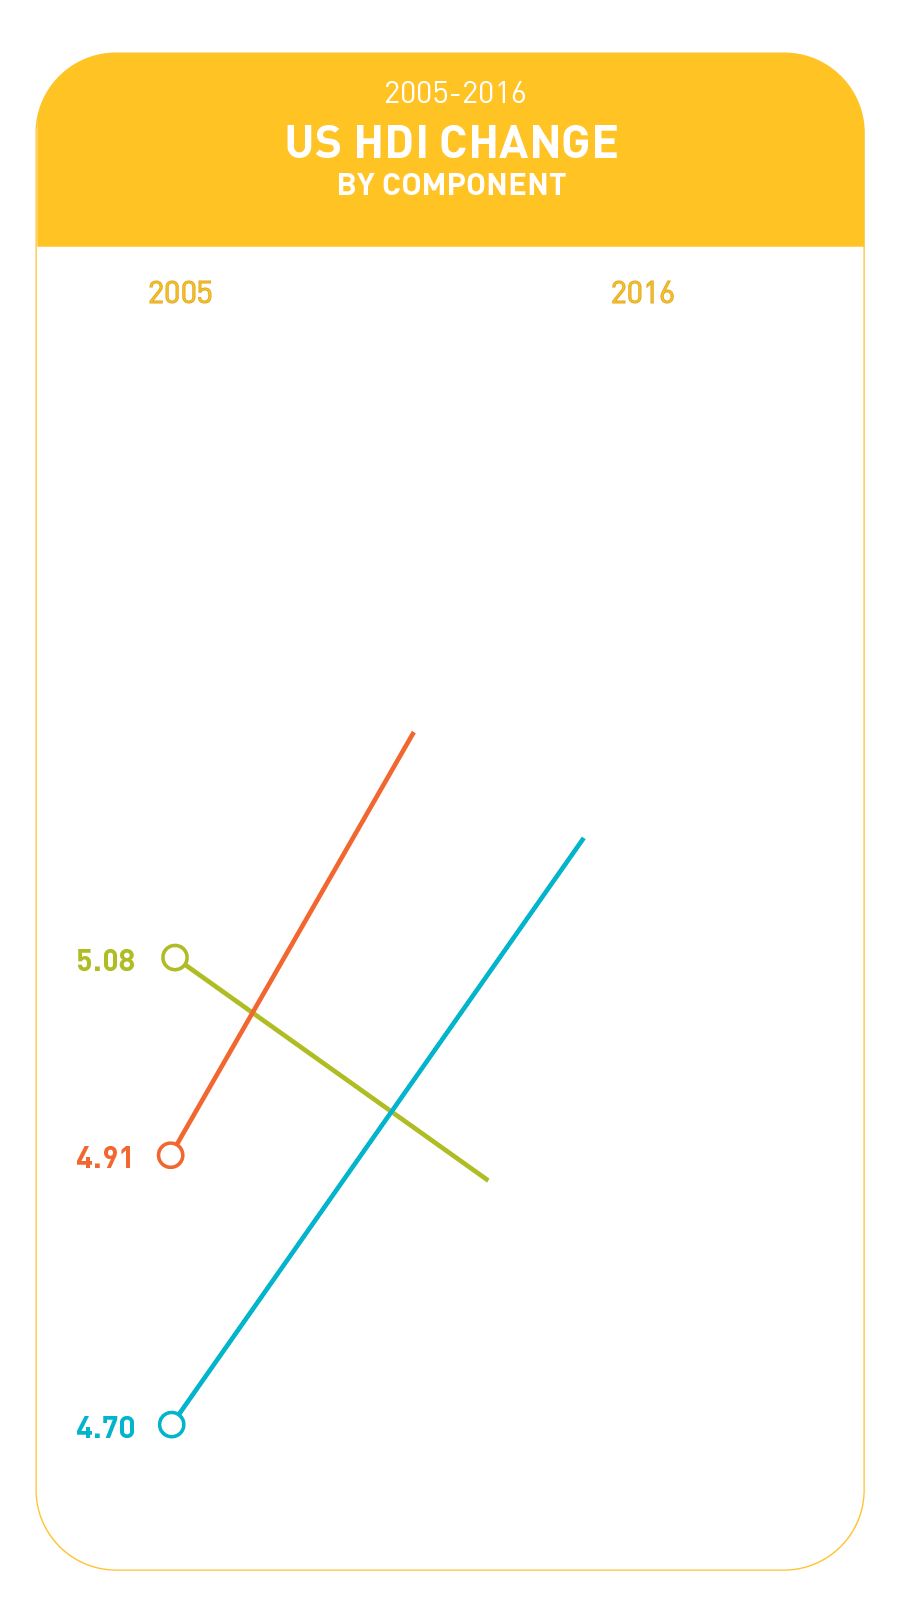
The United States saw mixed human progress between 2005 and 2016. The overall American Human Development Index (HDI) score increased by 6.4 percent on the strength of national gains in education and health. The Education Index increased by 11.6 percent, and the Health Index by 13.5 percent; the average American’s life expectancy at birth increased from 77.8 years in 2005 to 79.4 years in 2016. But the Income Index declined by 5.3 percent as median personal earnings fell from $33,288 in 2005 to $32,024 in 2016 (in 2016 dollars).


A Long and Healthy Life
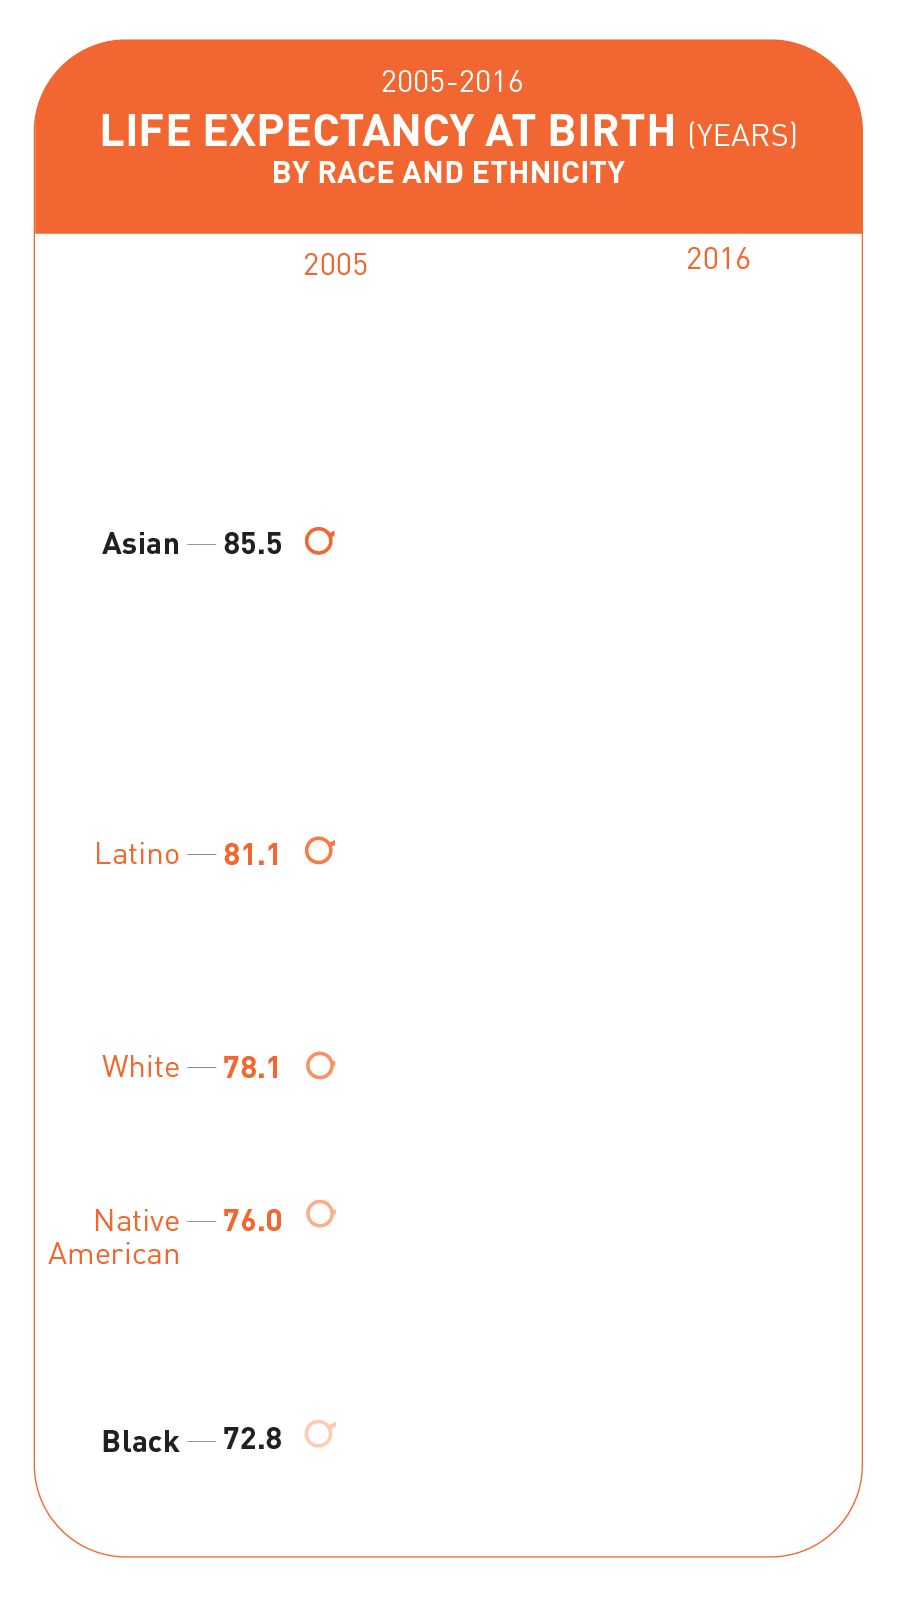
In the American Human Development Index, life expectancy at birth serves as a proxy for the capability to live a long and healthy life. It counts as one-third of the overall index value. Life expectancy is the number of years a baby born today can expect to live if current patterns of mortality continue throughout that baby’s life; it is a widely used summary measure of population health. Knowing how long different groups of people live is vitally important for understanding what contributes to long lives, for designing and delivering health services, and for monitoring the impact of efforts made to improve health.
Advancing human development requires, first and foremost, expanding the real opportunities people have to avoid premature death by disease or injury, to enjoy protection from arbitrary denial of life, to live in a healthy environment, to maintain a healthy lifestyle, to receive quality medical care, and to attain the highest possible standard of physical and mental health.
Life expectancy in the US is now 79.4 years, an increase of 1.6 years since 2005.
American women outlive American men by five years—81.9 as compared to 76.8. Around the world, women tend to live longer than men, pointing to some biological differences between the sexes that advantage women. But the male-female life expectancy gap in different places and among different racial and ethnic groups in the United States varies, indicating the existence of social contributors as well. Gender norms—which define what girls and boys, women and men, are expected to do and be in specific social contexts—create differing patterns of health-promoting and health-risk behaviors. Compared to US girls and women, boys and men are more likely to die by homicide, by suicide, and as a result of unintentional injuries like car crashes; are more likely to engage in substance abuse; are more likely to be exposed to health risks at work; and more often resort to violence. They are also less likely to seek medical care. These social realities shorten men’s lives.
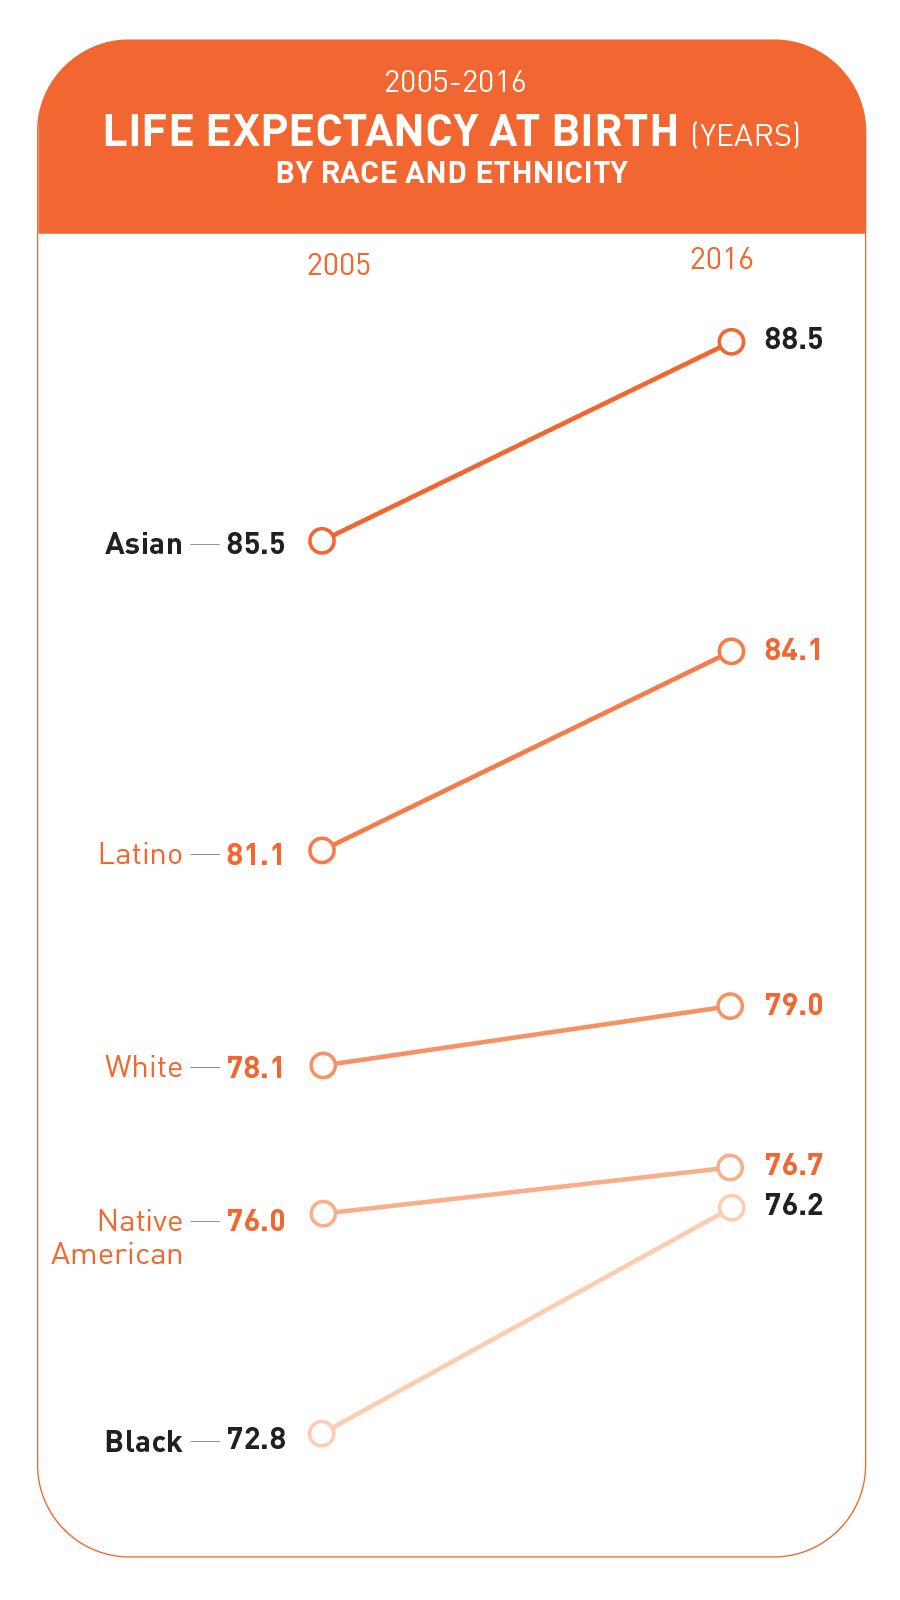
Adding race and ethnicity to gender widens the life expectancy gap to 17.8 years. Asian women enjoy the longest lives by a huge margin; their life expectancy is an astonishing 90.5 years. Latina women come in second, with a life expectancy of 86.9 years—nearly four years less. Although women live longer than men on average, US Asian men (86.2 years) outlive white, black, and Native American women.
Life expectancy for white women is 81.4 years, just a matter of months longer than Latino men (81.2 years). Native American women can expect to reach their eightieth birthdays, and black women are close behind, with a life expectancy of 79.4 years. White men (76.6 years), Native American men (73.4 years), and black men (72.7 years) have the shortest lives.
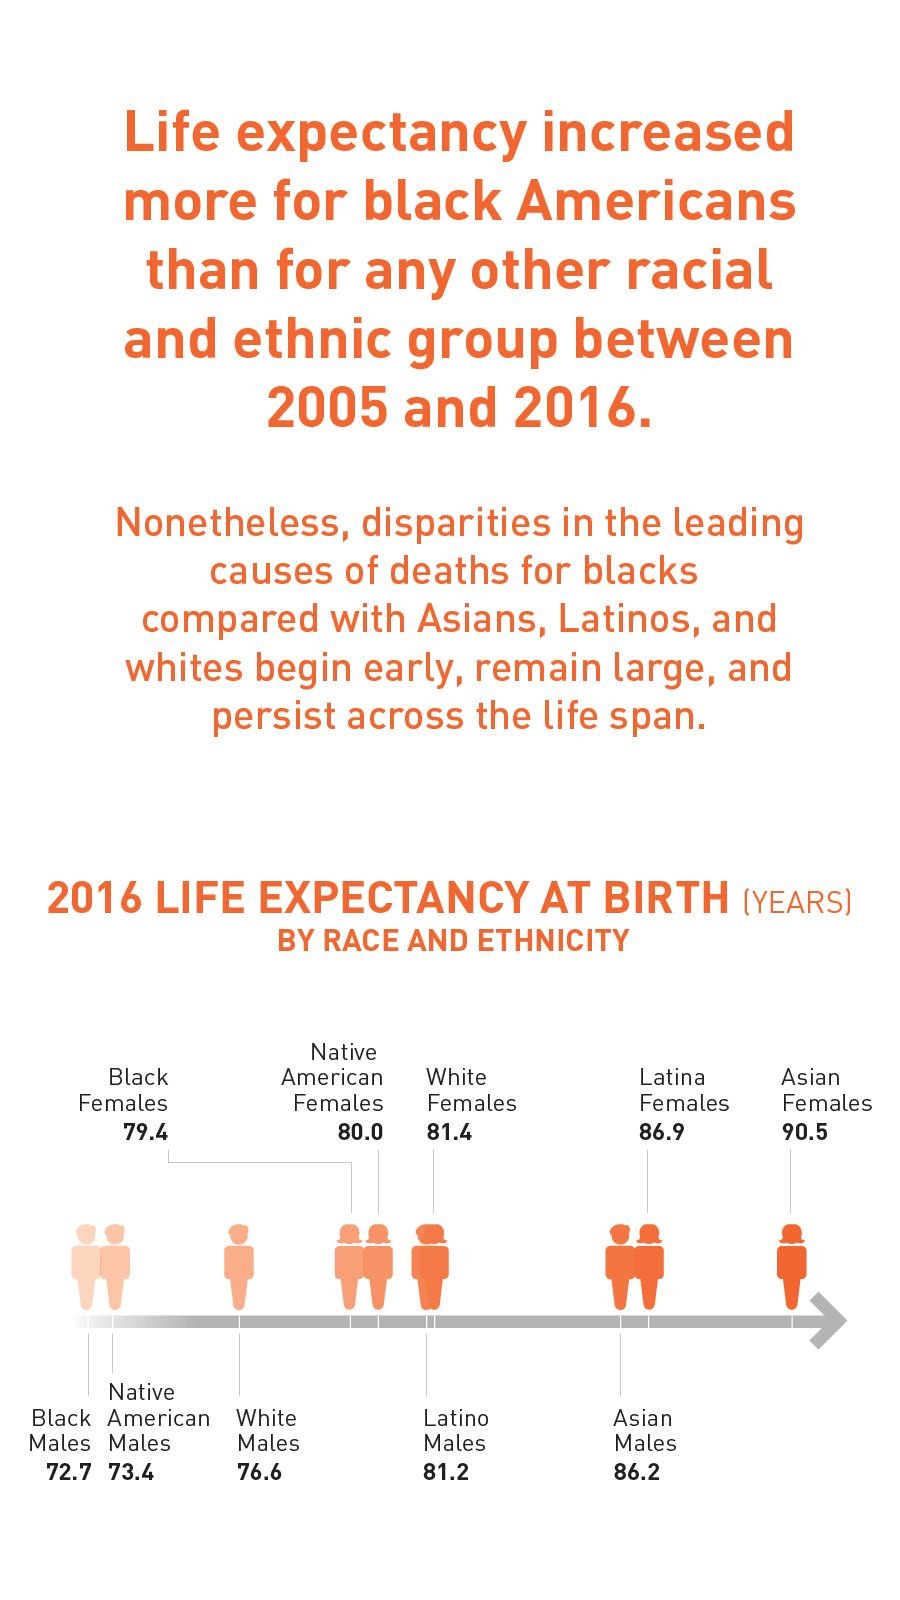
In 2005, a 12.7-year gap separated Asian and black residents; that gap has now narrowed to 12.3 years, thanks to African American health gains. Life expectancy has increased 4.9 percent for black men and 4.4 percent for black women over the last decade, the fastest rates of change among the major racial and ethnic groups. Nonetheless, disparities in the leading causes of deaths for black Americans compared with Asians, Latinos, and whites begin early, remain large, and persist across the life span. Infant mortality among whites ranges from 2.52 per 100,000 in DC to 7.04 per 100,000 in Arkansas; among blacks, the range is 8.27 per 100,000 in Massachusetts to 14.28 per 100,000 in Wisconsin. In other words, the lowest state infant mortality rate for blacks is greater than the highest state rate for whites.4 Black Americans have higher death rates than whites for all causes of mortality in all age groups up to age 65.5
While overall health trends from the past decade are positive, data from the last two years are cause for serious concern. Life expectancy in the US has plateaued since 2015. Among the causes are a rise in the abuse of opioids like prescription painkillers and an increase in suicides.6
Access to Knowledge
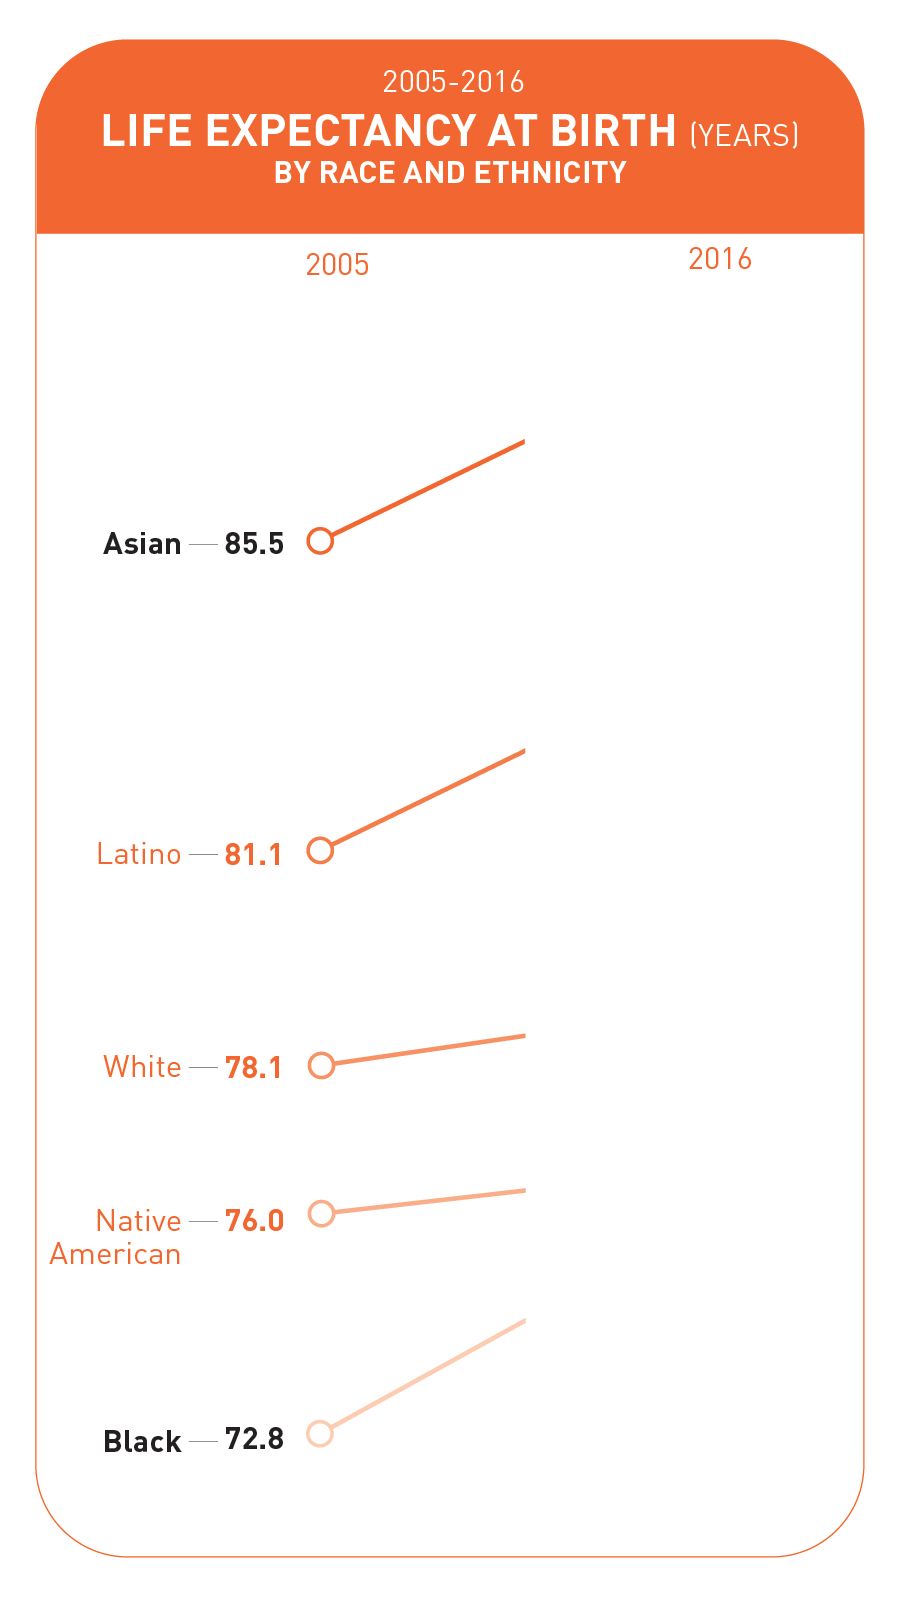
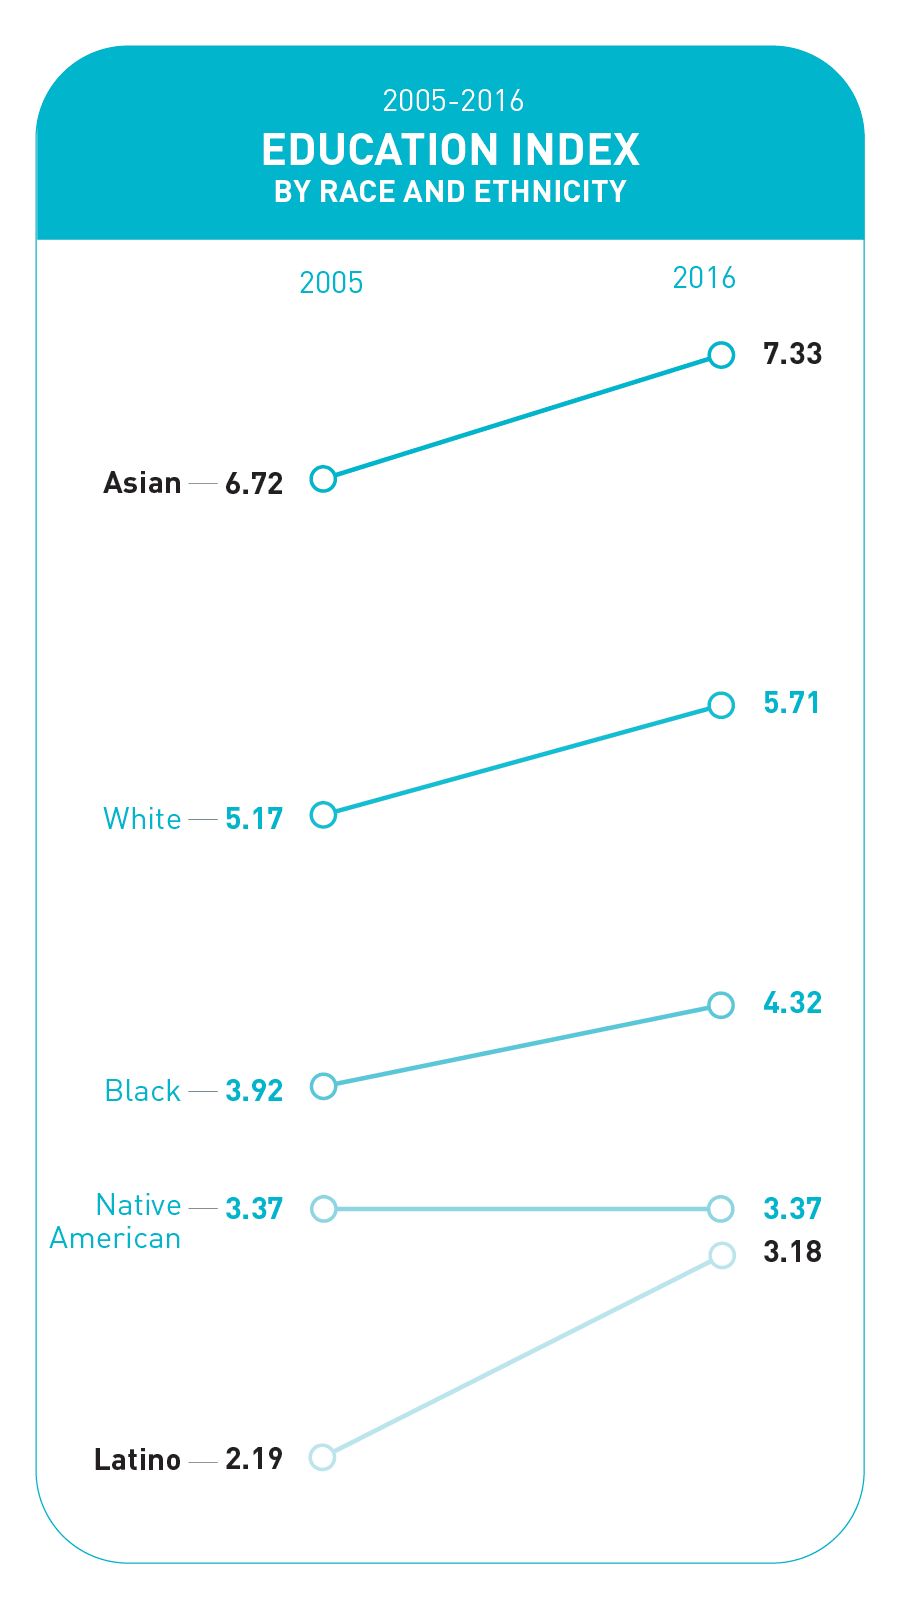
The second component of the American Human Development Index is access to knowledge, measured by degree attainment for all adults age 25 and older and school enrollment for children and young adults ages 3–24.
Education is essential to agency, self-sufficiency, and the real freedom a person has to decide what to do and who to be. Education is a means to a host of desirable ends, better jobs and bigger paychecks being two. People with higher levels of education earn more and are less likely to be unemployed than those whose formal educations ended with high school; they are also concentrated in higher-paying occupations that tend to be more interesting and engaging and to offer better working conditions, greater societal respect, more autonomy, and more extensive benefits. But the benefits of education are not just economic. For society as a whole, higher levels of educational attainment are associated with less crime, lower incarceration rates, and greater civic engagement, political participation, tolerance of difference, and support for the rights of others. For individuals, more education is associated with better health and longer lives; lower divorce rates; more effective coping skills; increased resilience; and greater ability to adjust to change.
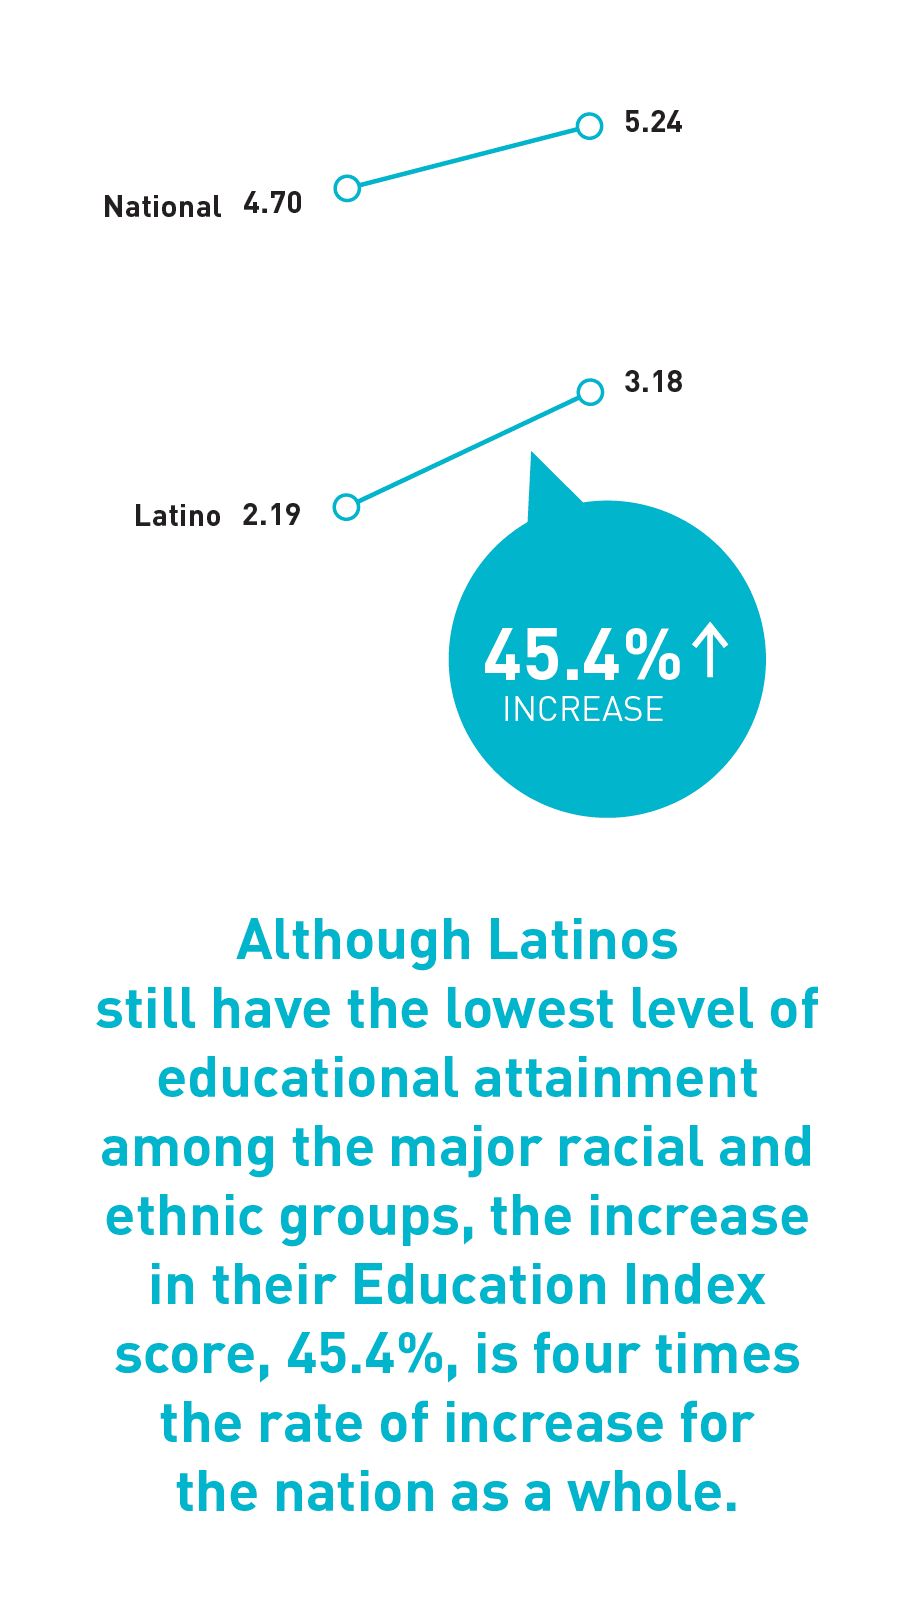
For the nation as a whole, the Education Index score increased over half a point, from 4.70 in 2005 to 5.24 in 2016, an 11.6 percent increase.
Women have a higher Education Index score than men, 5.42 as compared with 5.06. In 2005, women and men had the same Education Index score, 4.70. Both women and men’s scores improved over the past decade, but women’s score increased twice as fast. Women ages 25 and up have become slightly more likely than their male counterparts to have earned bachelor’s and graduate degrees. Girls and young women are also slightly more likely to be enrolled in school than boys and young men.
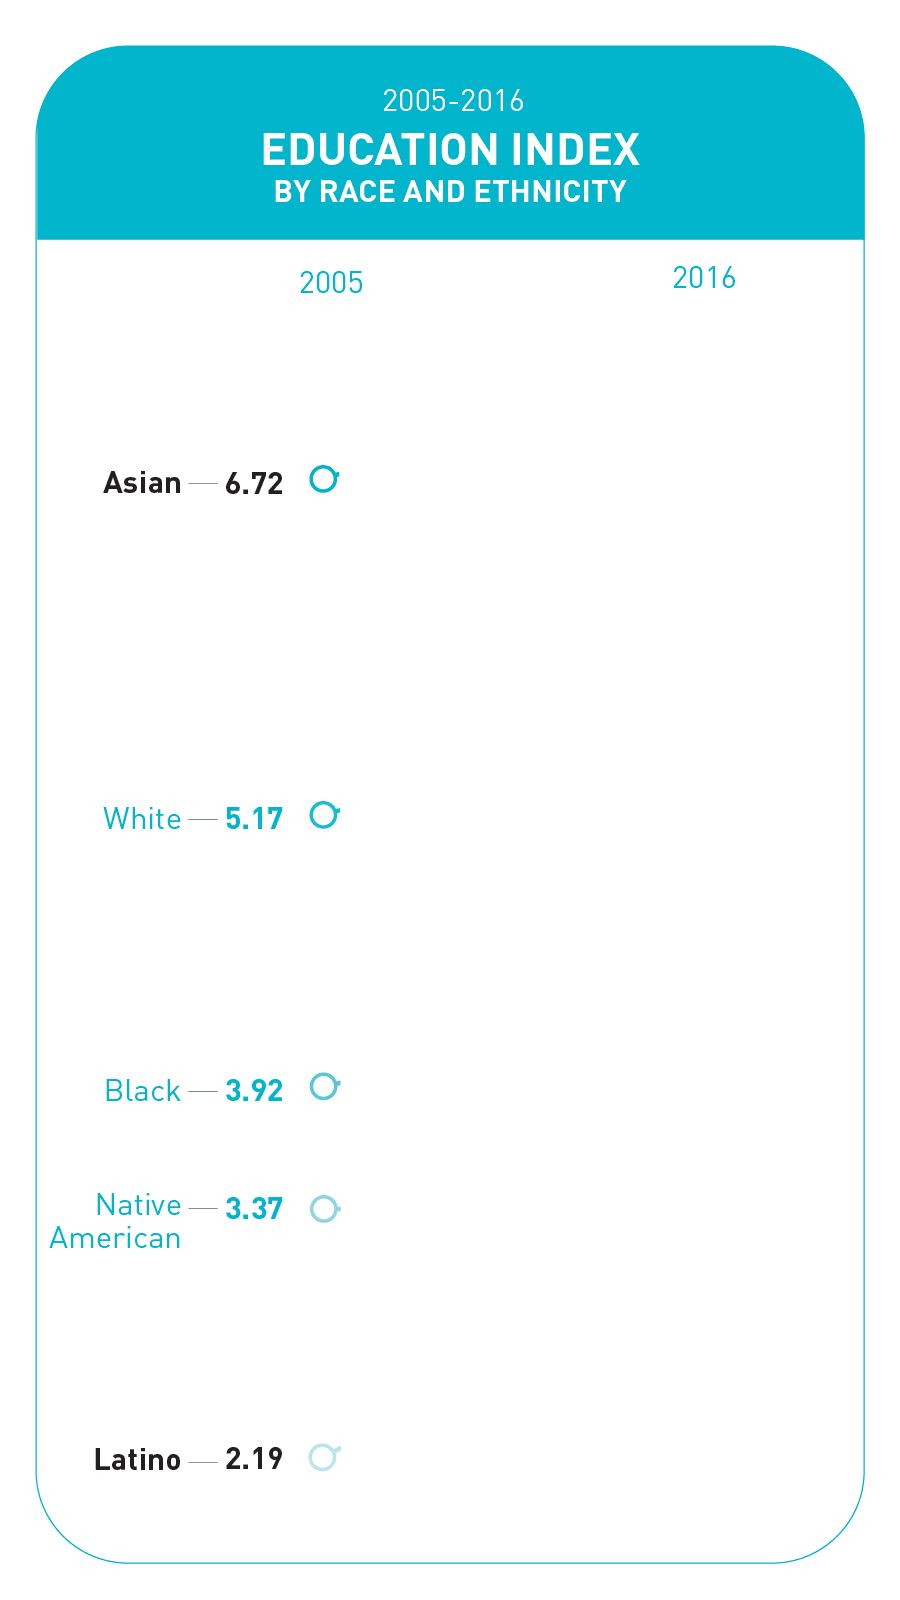
Among racial and ethnic groups, Asians have the highest Education Index score overall, 7.33. This represents an increase from their 2005 score of 6.72. Asian men outperform Asian women in education, scoring 7.62 as compared to 7.10. Asians are the only group in which men have a higher education score than women. More than half of Asian adults have at least a four-year bachelor’s degree.
Whites have the next-highest Education Index score, 5.71. Women score higher than men—5.85 compared to 5.57. White women and men saw increases to their Education Index scores, but men’s score improved by just 6.8 percent, about half as much as the countrywide improvement.
Black residents saw their Education Index score improve by about 10 percent, from 3.92 in 2005 to 4.32 in 2016. Black women have a much stronger performance in education than black men, scoring 4.71 compared to 3.91.
The 2016 Native American score on the Education Index is 3.37—the exact same score as in 2005. This disheartening lack of progress is one reason for the overall well-being decline among Native American men. Native American women (3.70) have a higher score than Native American men (3.04).
Although Latinos still have the lowest education scores among the major racial and ethnic groups—3.18 overall, 3.46 for women, and 2.90 for men—they have made astonishing progress over the last decade. The increase in their Education Index score, 45.4 percent, is four times the national average.

A Decent Standard of Living
Money isn’t everything, but it’s not nothing, either; it is a critical ingredient of overall well-being. Thus, one-third of the American Human Development Index is devoted to the capabilities people have to enjoy a decent material standard of living: to have the money necessary to live well, afford health care, be well-nourished, feel secure about the future, pursue educational opportunities and leisure activities, and much more. Many different measures can be used to gauge people’s material standard of living. The American Human Development Index uses median personal earnings—the wages and salaries of all full- and part-time workers 16 years of age and older. These earnings figures may seem low; this is because many researchers use household earnings rather than personal earnings to gauge material well-being. Measure of America uses personal rather than household earnings to better understand the differences between women and men when it comes to pay.
Median personal earnings is the only component of the HD Index to have decreased nationwide over the last ten years. US median earnings were $33,288 in 2005 (converted to 2016 dollars) and $32,024 in 2016. This is a 3.8 percent wage decrease for the typical worker, and a major red flag. Despite the booming economy of recent years, most Americans have seen a pay cut.
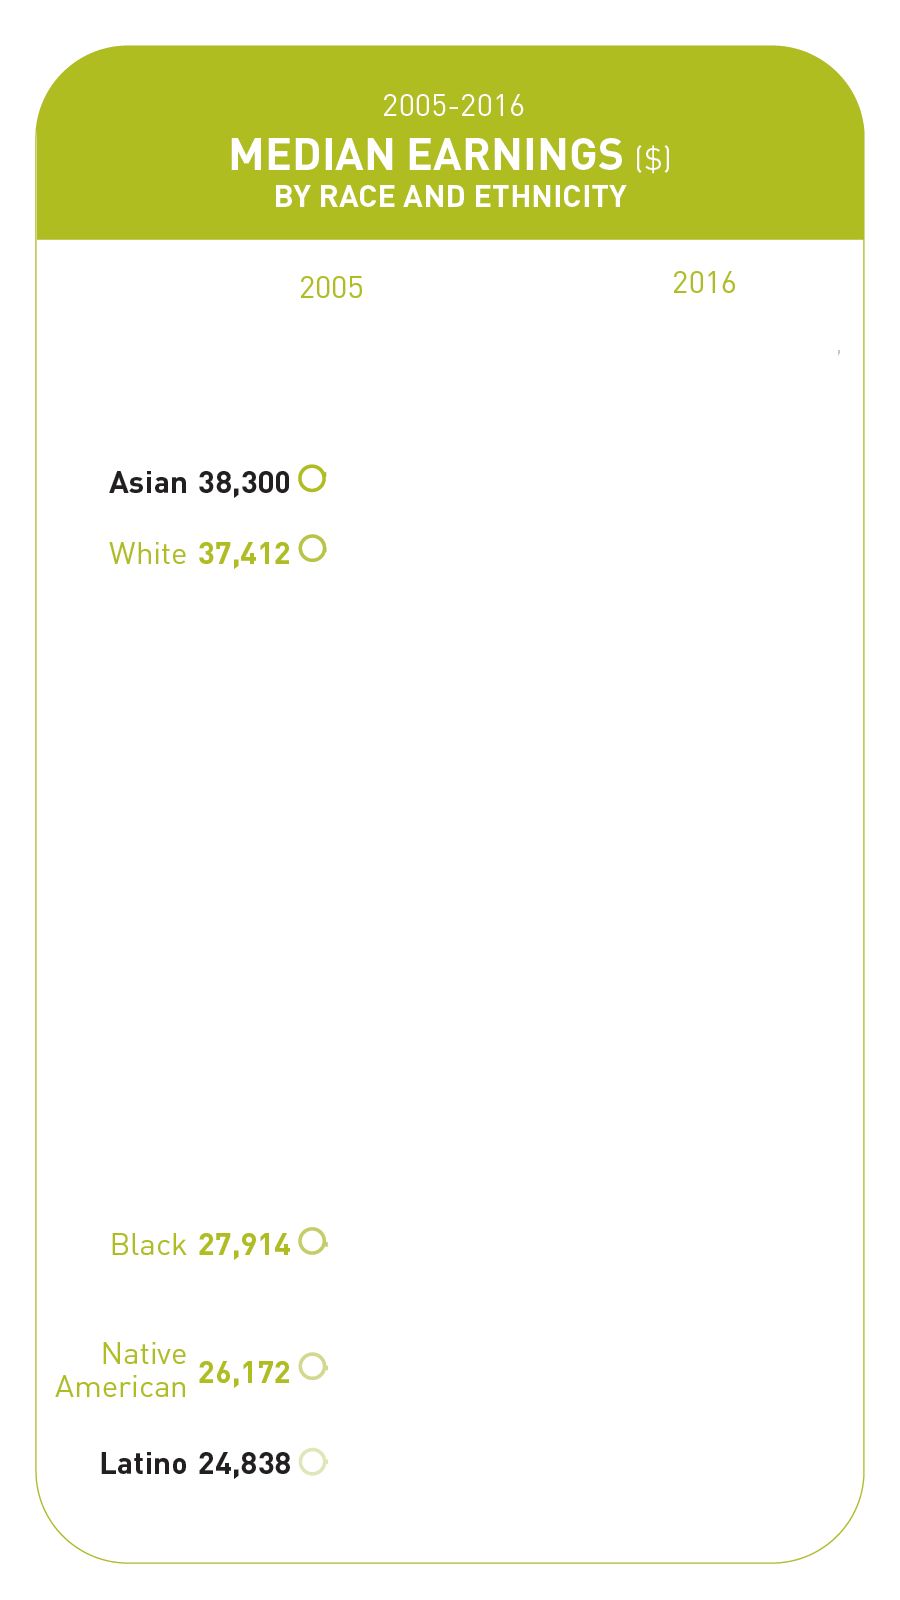
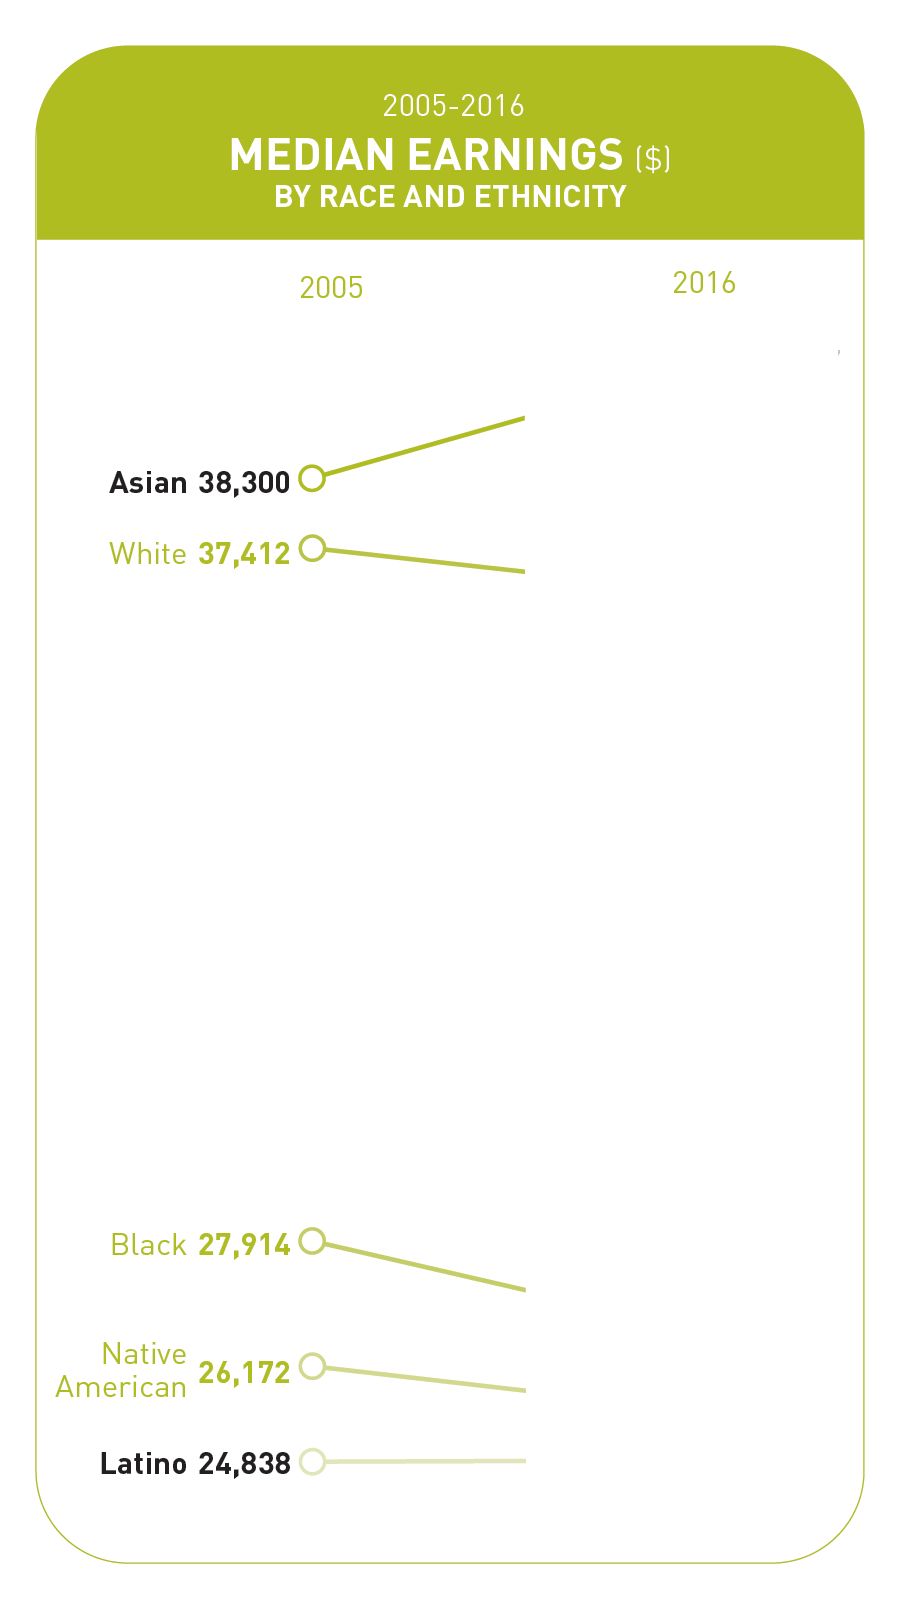
In every racial and ethnic group, men earn more than women, though the size of the gap varies.
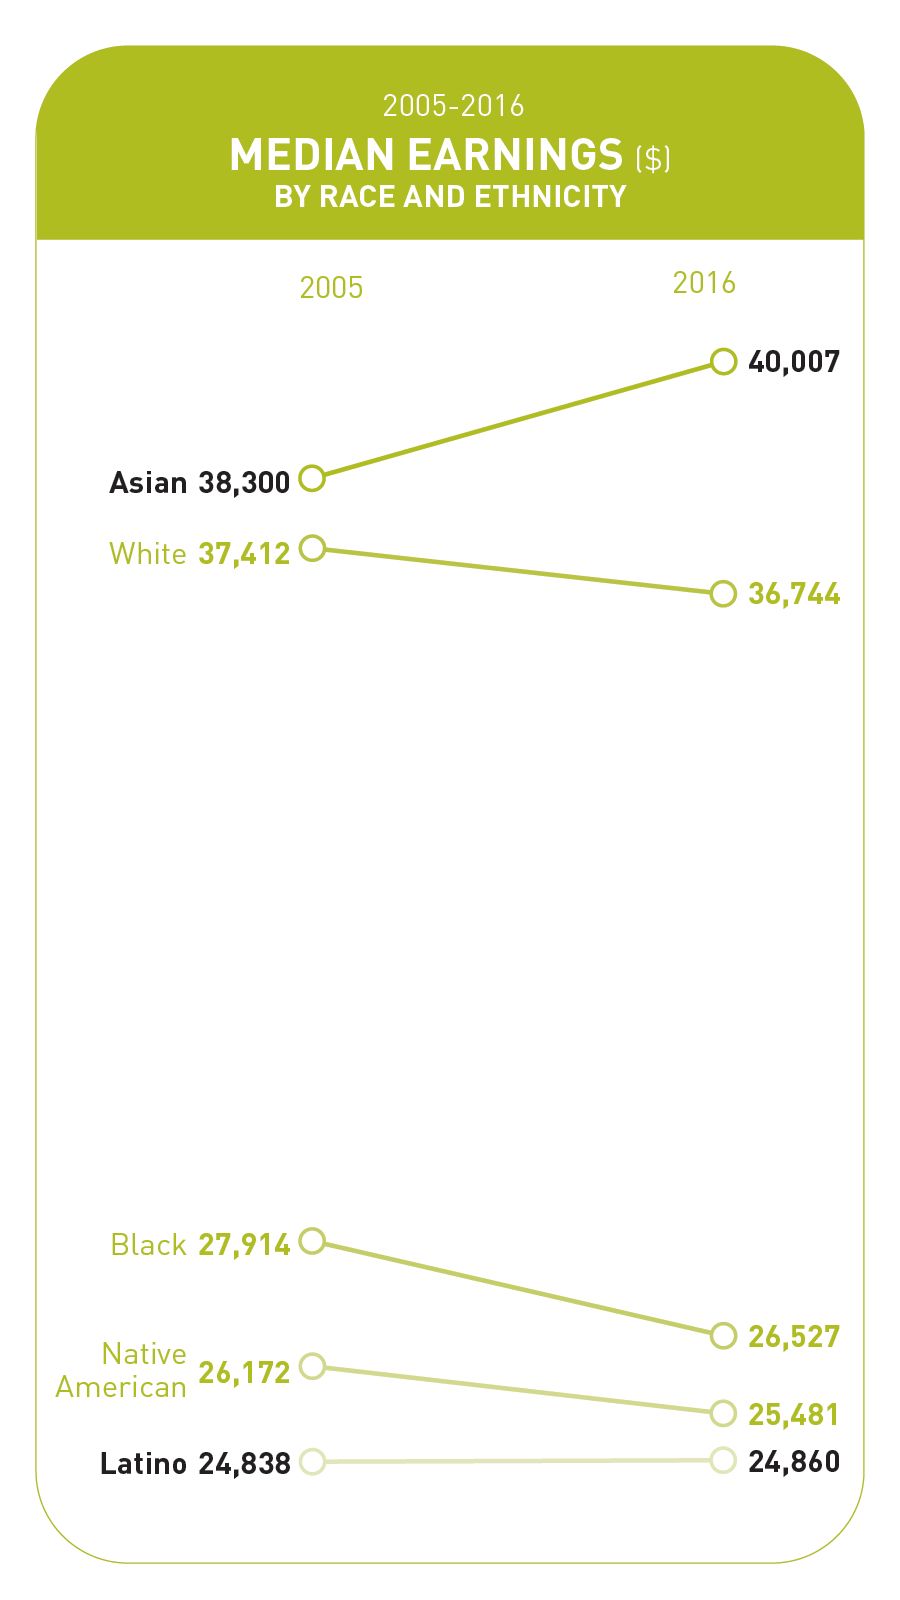
Asian men ($46,894) and white men ($44,080) top the earnings chart. The next-highest earners, Asian women ($32,161) and white women ($30,480), earn roughly two-thirds of what their male counterparts do. Among these top-earning racial and ethnic groups, the gender earnings gap is around $14,000.
Black men ($28,473), Latino men ($27,966), and Native American men ($27,457) earn within $1,000 of one another. Black women ($25,265), Native American women ($22,820), and Latina women ($20,769) all earn less than their male counterparts—despite having higher Education Index scores. Among these three racial and ethnic groups, gender earnings gaps range from about $3,000 to about $7,000.
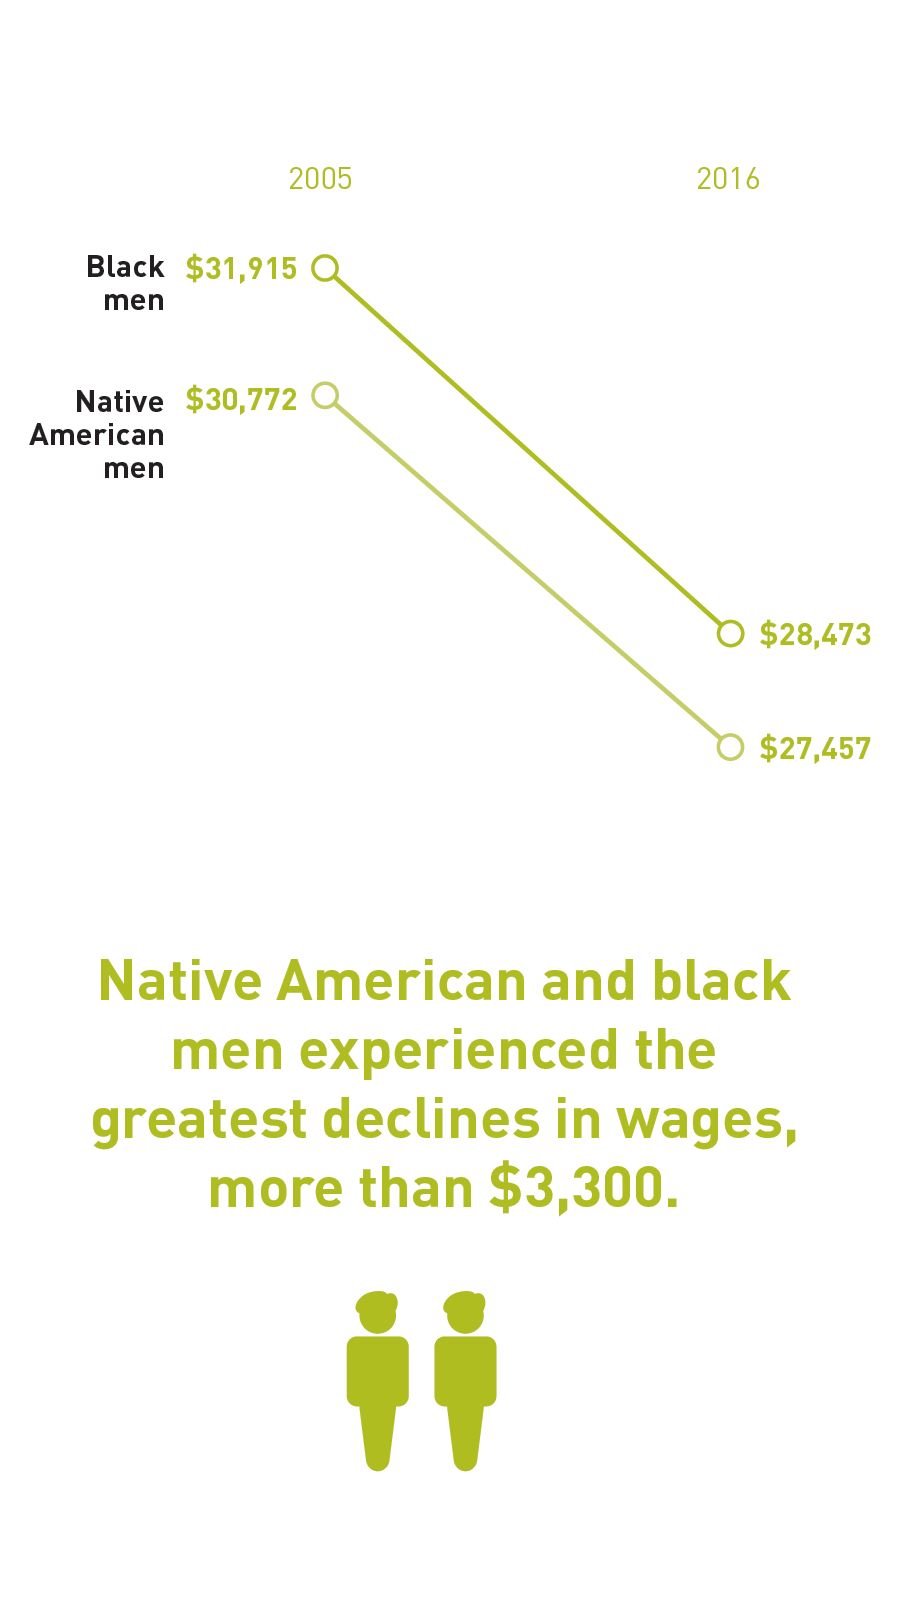
As mentioned above, median personal earnings fell in real terms between 2005 and 2016 by 3.8 percent, or $1,264. But not everyone saw their wages decline. White women saw an earnings gain of $2,042, the largest boost of any race-gender combination. Asian men’s earnings increased by $1,784, Latina women’s by $1,016, and Latino men's by $620. Black women saw their wages decline by $364, and white men saw theirs drop by $1,544. The greatest wage declines, more than $3,300, were experienced by Native American and black men.

Wages are not growing for struggling and middle-class Americans; only upper-income families have reaped the rewards of the post-recession economic recovery. In fact, over the last half century, the gap between high-income earners and middle- and low-wage workers has steadily grown, a trend that shows no signs of abating.7
HDI BY STATE
Overall HDI
Today, the highest American Human Development Index scores are found in Washington, DC (6.92), Massachusetts (6.36), and Connecticut (6.31). The lowest scores are found in Arkansas (4.17), Mississippi (4.05), and West Virginia (3.94). Generally speaking, states in the Northeast are faring the best, while most Southern states are struggling. The ten states with the lowest HD Index scores today are all found in the South or Southwest. The ten top-scoring states are more regionally diverse, although half are in the Northeast and seven are on the East Coast.
Most states are better off today than they were a decade ago; Washington, DC, and 44 states saw increases in their HD Index scores. Six states saw no significant change in their HD Index scores: Michigan, Alaska, West Virginia, New Hampshire, Vermont, and Rhode Island.
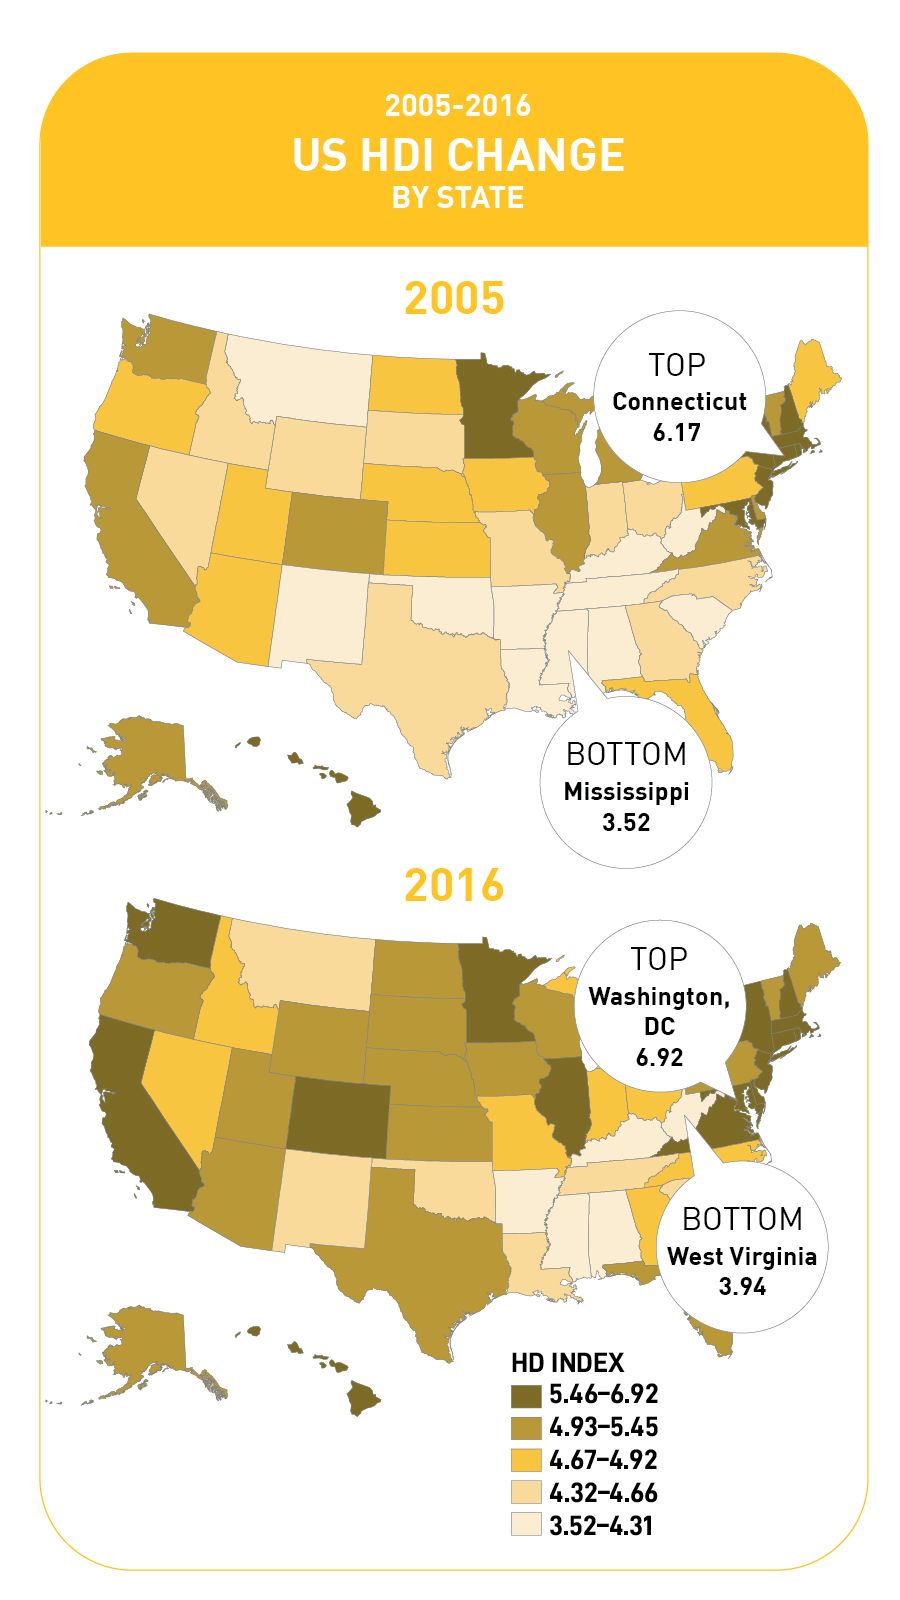
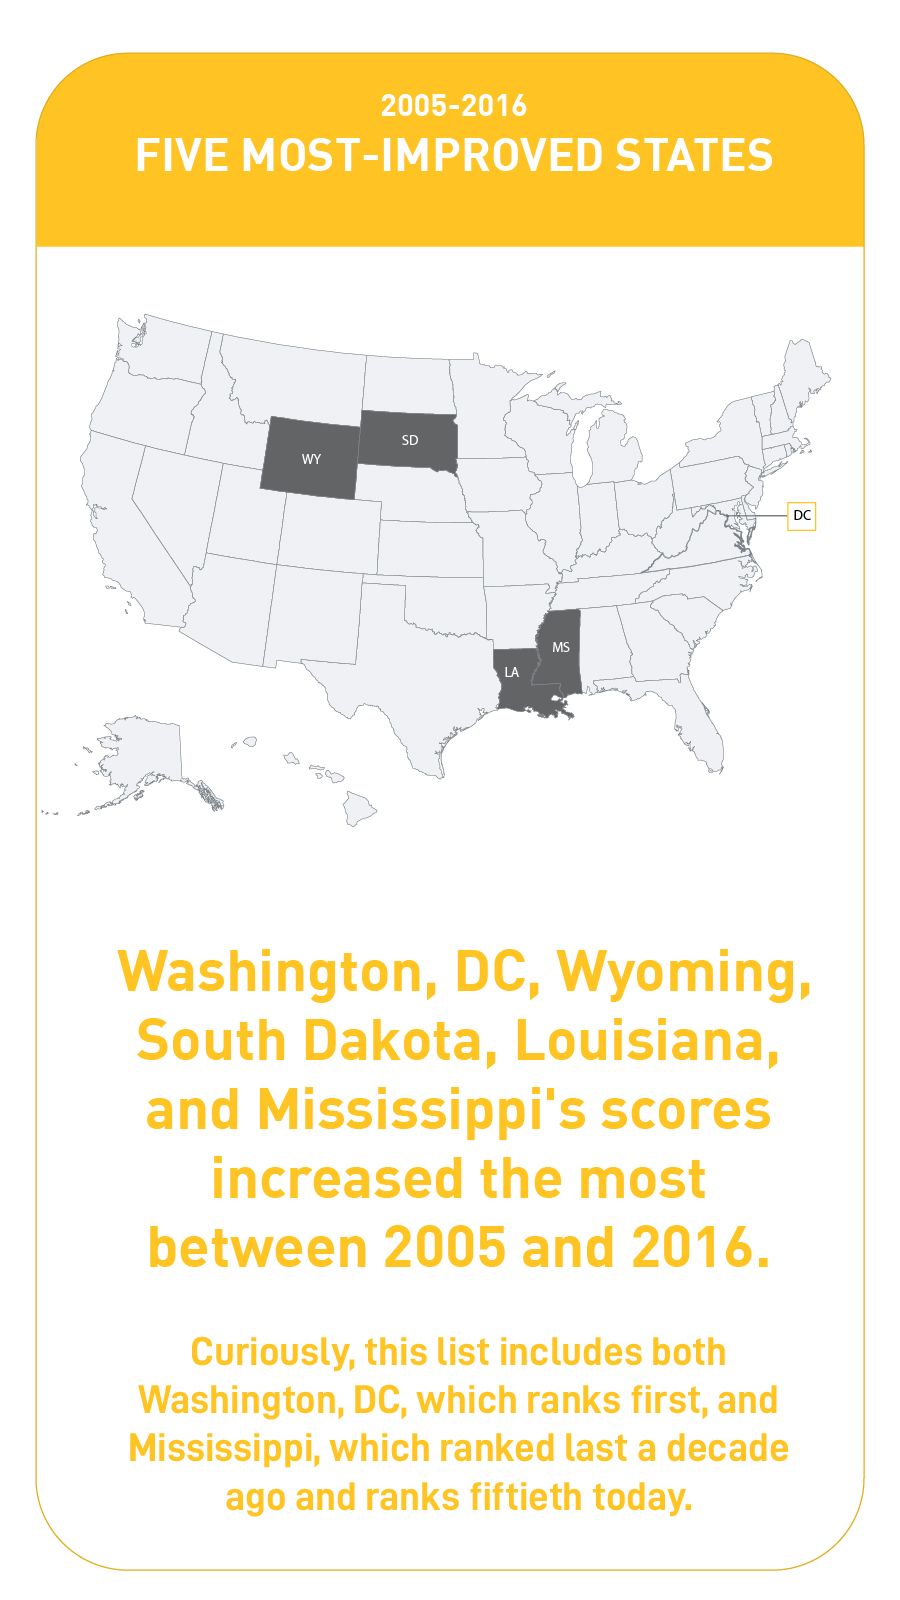
The greatest increases in HD Index scores occurred in Washington, DC, Wyoming, Louisiana, Mississippi, and South Dakota. Curiously, this list includes both Washington, DC, which ranks first in the country, and Mississippi, which ranked last a decade ago and ranks fiftieth today. Gains did not always occur evenly across the three areas of the index; some states saw big gains in one area but made no progress in another. The five most-improved states moved up the HD Index scale in different ways. Washington, DC, experienced big gains across all three areas of well-being. Wyoming gained an entire point in its Education Index score. The improvement in South Dakota was due mainly to a big boost in earnings. Louisiana made big gains in life expectancy. Mississippi made improvements in health and education, but saw no significant change in earnings.
North Dakota, despite seeing the greatest increase in earnings, is one of a handful of states that saw no increase in life expectancy. Similarly, West Virginia made big strides in education, but also saw no life expectancy gains. Nevada, on the other hand, saw an increase in life expectancy, but experienced the sharpest decline in median earnings.

The bottom line: since 2005, virtually all states have seen an improvement in education, most have longer life expectancies, but only about one in five has higher median earnings.
Health
By and large, Americans in most states are living longer; forty-three states and Washington, DC, have longer life expectancies today than they did ten years ago. Washington, DC, residents are living an impressive 4.6 years longer, on average. Louisiana and California had the second- and third-greatest gains in life expectancy, both increasing by just over 2 years.
Education
Most parts of the United States have seen a measurable improvement in education, with a few exceptions. North Dakota, Alaska, Hawaii, and Vermont saw no change to their overall Education Index scores. Alaska is the only state that saw no change in any of the education indicators that make up the index. The remaining forty-six states and Washington, DC, have higher Education Index scores today than in 2005.
Educational attainment has either increased or seen no significant change across all educational levels and across all states and Washington, DC.
Four states saw no significant change in high school degree attainment: Alaska, Nebraska, Vermont, and Wyoming; these states already had some of the highest rates of adults with at least a high school diploma, so there was less room for improvement. Everywhere else, the rate of adults with at least a high school degree increased between 1.4 and 6.7 points. The greatest increases in high school attainment took place in Washington, DC (8 percent), Kentucky (7.8 percent), and Tennessee (7.2 percent); interestingly, these three states land at opposite ends of the well-being spectrum—Washington, DC, ranks first on the overall HD Index, while Tennessee and Kentucky rank forty-fifth and forty-seventh.
Only one state, Alaska, saw no significant change in college degree attainment. In all other states and Washington, DC, bachelor’s degree attainment among adults increased. The greatest increases in the share of adults with at least a bachelor’s degree took place in Washington, DC (26.9 percent), Nebraska (23.7 percent), and South Dakota (22.9 percent).
In seven states, there has been no significant change in graduate degree attainment: North Dakota, Alaska, New Mexico, Delaware, Idaho, Vermont, and Wyoming. All other states and Washington,DC, saw increases in the share of adults with graduate degrees. The greatest gains in graduate degree attainment were in Nebraska (36.8 percent), South Dakota (36.2 percent), and North Carolina (34.1 percent).
Progress in school enrollment has been less dramatic. Thirty states have seen increases in school enrollment among children and young adults, eighteen states and Washington, DC, saw no significant change, and in two states, North Dakota and Hawaii, the rate of school enrollment declined by 9.1 and 4.5 percent, respectively. The largest gains in school enrollment took place in Wyoming (9.6 percent), Idaho (7.3 percent), and Delaware (7.2 percent).
Earnings
While the changes in health and education over the last ten years have been overwhelmingly positive, earnings tell a different story. Only ten states and Washington, DC, have seen increases in median personal earnings. Median earnings are between $700 and $6,200 higher today than in 2005 in North Dakota, Washington, DC, South Dakota, Wyoming, Oklahoma, Utah, Louisiana, Arkansas, Nebraska, Iowa, and Texas. With the exception of Washington, DC, most of these states are in the US heartland. The greatest gains in earnings took place in North Dakota ($6,200), Washington, DC ($5,500), and South Dakota ($3,700). In nineteen states, the typical worker makes less today than he or she did ten years ago, and in another twenty-one states, typical paychecks have remained flat. The biggest drops in earnings took place in Nevada ($3,900), California ($3,800), and Michigan ($3,000).
Conclusion
There are many causes for optimism in this sea of numbers, one of which is the major national increase in educational attainment over the last decade, which augurs well for the future. Better educated people tend to have better health, longer lives, higher earnings, higher employment rates, higher voting rates, greater ability to adapt to change, more stable interpersonal relationships, lower poverty rates, and less involvement with the criminal justice system.8
The massive improvement in well-being among Latino men and women is likewise a cause for celebration, as is the striking progress of black women. Asian men and women and white women, who, along with white men, have the country’s highest HDI scores, continued to record gains over the last ten years.
Recent surveys have shown Asians and Latinos to be more optimistic about their futures than whites, and these positive human development advances could be one reason why.9 It is important to note, however, that these surveys are from a few years ago; today’s sentiments may differ. White men still perform above the national average, with a score of 5.67, but they have made the slowest progress of any group but Native American men, possibly contributing to the much-reported-on sense that many white men, particularly those who are working class, feel left behind by the economic, social, and demographic changes of recent decades.10
The most concerning trends relate to black and Native American men. While black men made welcome progress over the last decade in health, their earnings dropped by 10.8 percent, and their well-being score is the second-lowest among the race-gender combinations, 3.57. The lack of human development progress among Native American men is perhaps this report’s most worrisome finding; their educational attainment has not improved, their earnings are down more than 10 percent, theirs is the only HDI score to decrease over the last decade, and they have the lowest score, 3.29. It is imperative that we make their well-being a national priority. Today, more than one in four Native American and one in five black boys and young men between the ages of 16 and 24 are out of school and out of work; helping them navigate the often rocky transition to productive and joyous adulthoods is a good place to start.11

10 YEARS
MEASURE OF AMERICA


OUR STORY
Let’s go back in time, back to long-ago 2007. George W. Bush was in the oval office. A shiny, captivating new gadget called the iPhone was all the rage. And outside of academia and other expert circles, there was little talk of rising inequality. The one percent was already peeling off from the rest of us, but Occupy Wall Street was still four years away, and we were blissfully unaware that the bottom was about to fallout of the economy in December.
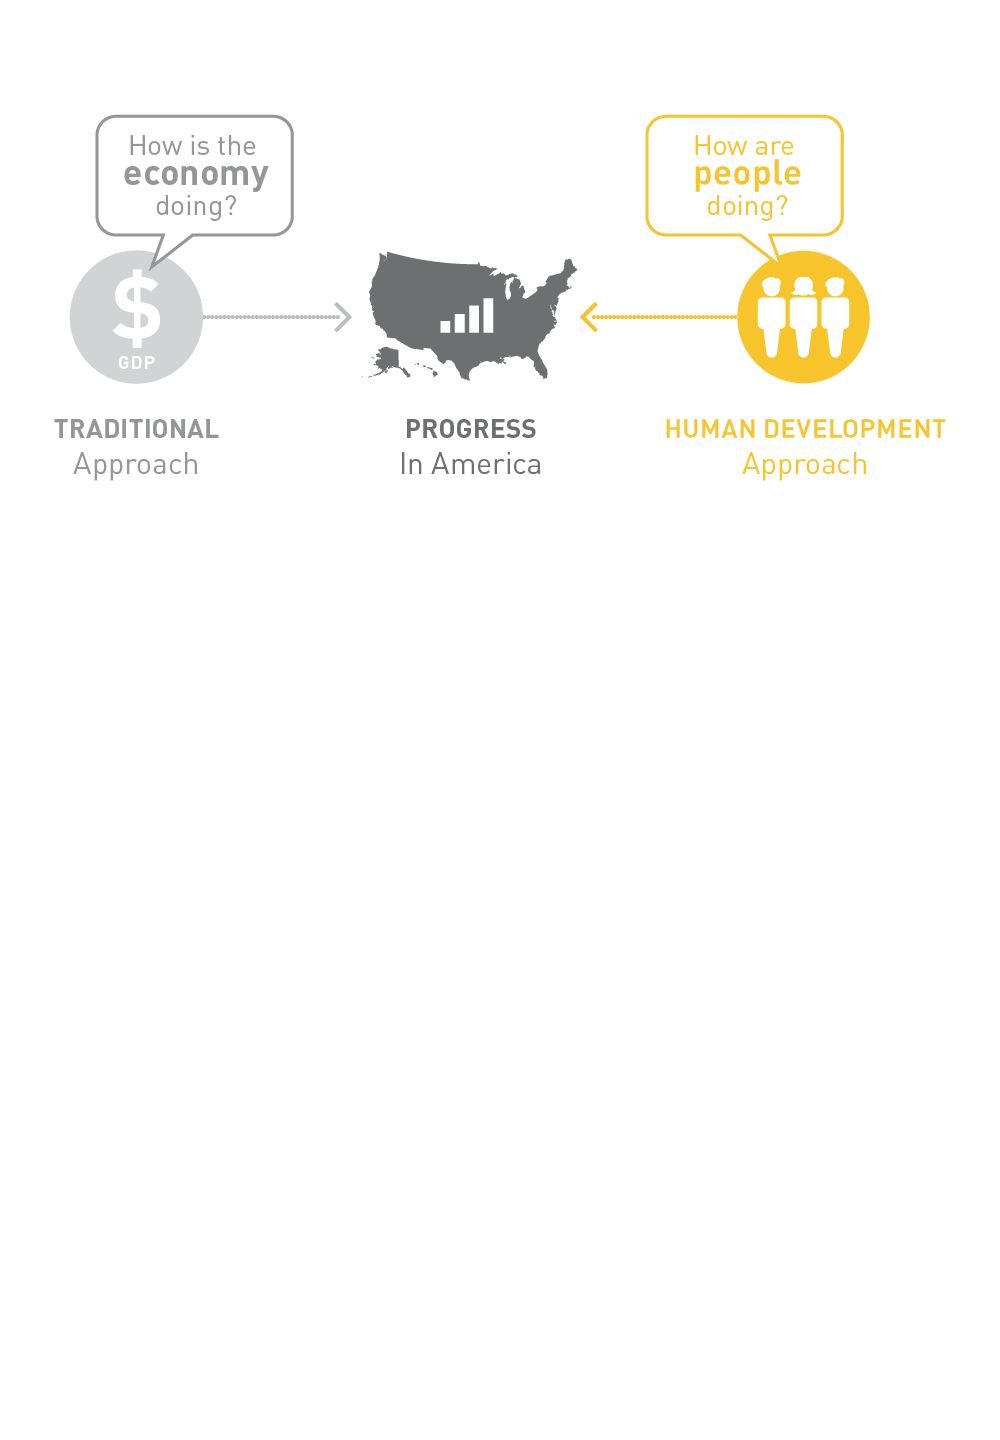
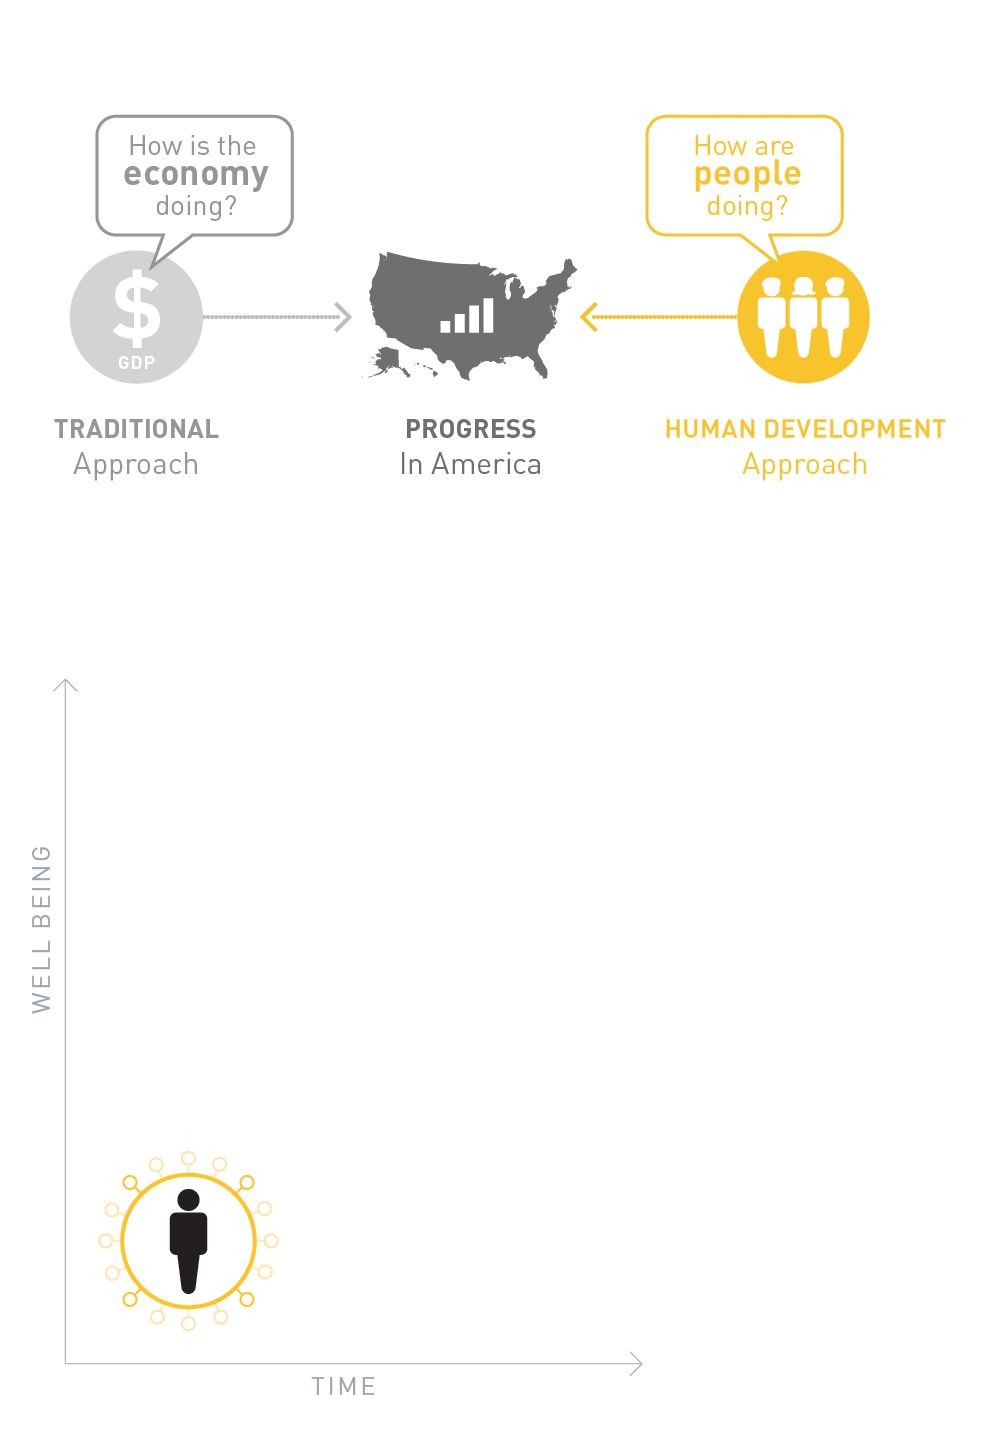
This was the context in which a friend and former colleague from the United Nations, Sarah Burd-Sharps, approached me with an exciting prospect: to work with her to introduce to the United States an idea—human development—that had broadened the way we understand, measure, and track people’s well-being around the world—from strictly economic metrics like GDP to a measure that captures some of the other things, besides money, that expand our choices, opportunities, and freedoms.
We were motivated chiefly by four impulses.
We wanted to:
- Explore inequality in a new way, one that included but went beyond money to bring in inequalities in health outcomes, access to quality education, voice and agency, life chances, and more.
- Bring good practices and new perspectives from other countries to bear on US problems, which we didn’t see happening at all.
- Contribute to a more reasoned, well-informed debate about fundamental issues by making objective data and social science research more accessible and digestible. (Data-loving nerds that we were, we didn’t fully understand that facts alone aren’t sufficient to create change; more on that below.)
- Try to make a difference in our own country, after many years of working in an international development context.
So we established a 501c3 and were fortunate enough to receive a founding grant from the Conrad N. Hilton Foundation—and we were off! We produced the first American Human Development Report in 2008.
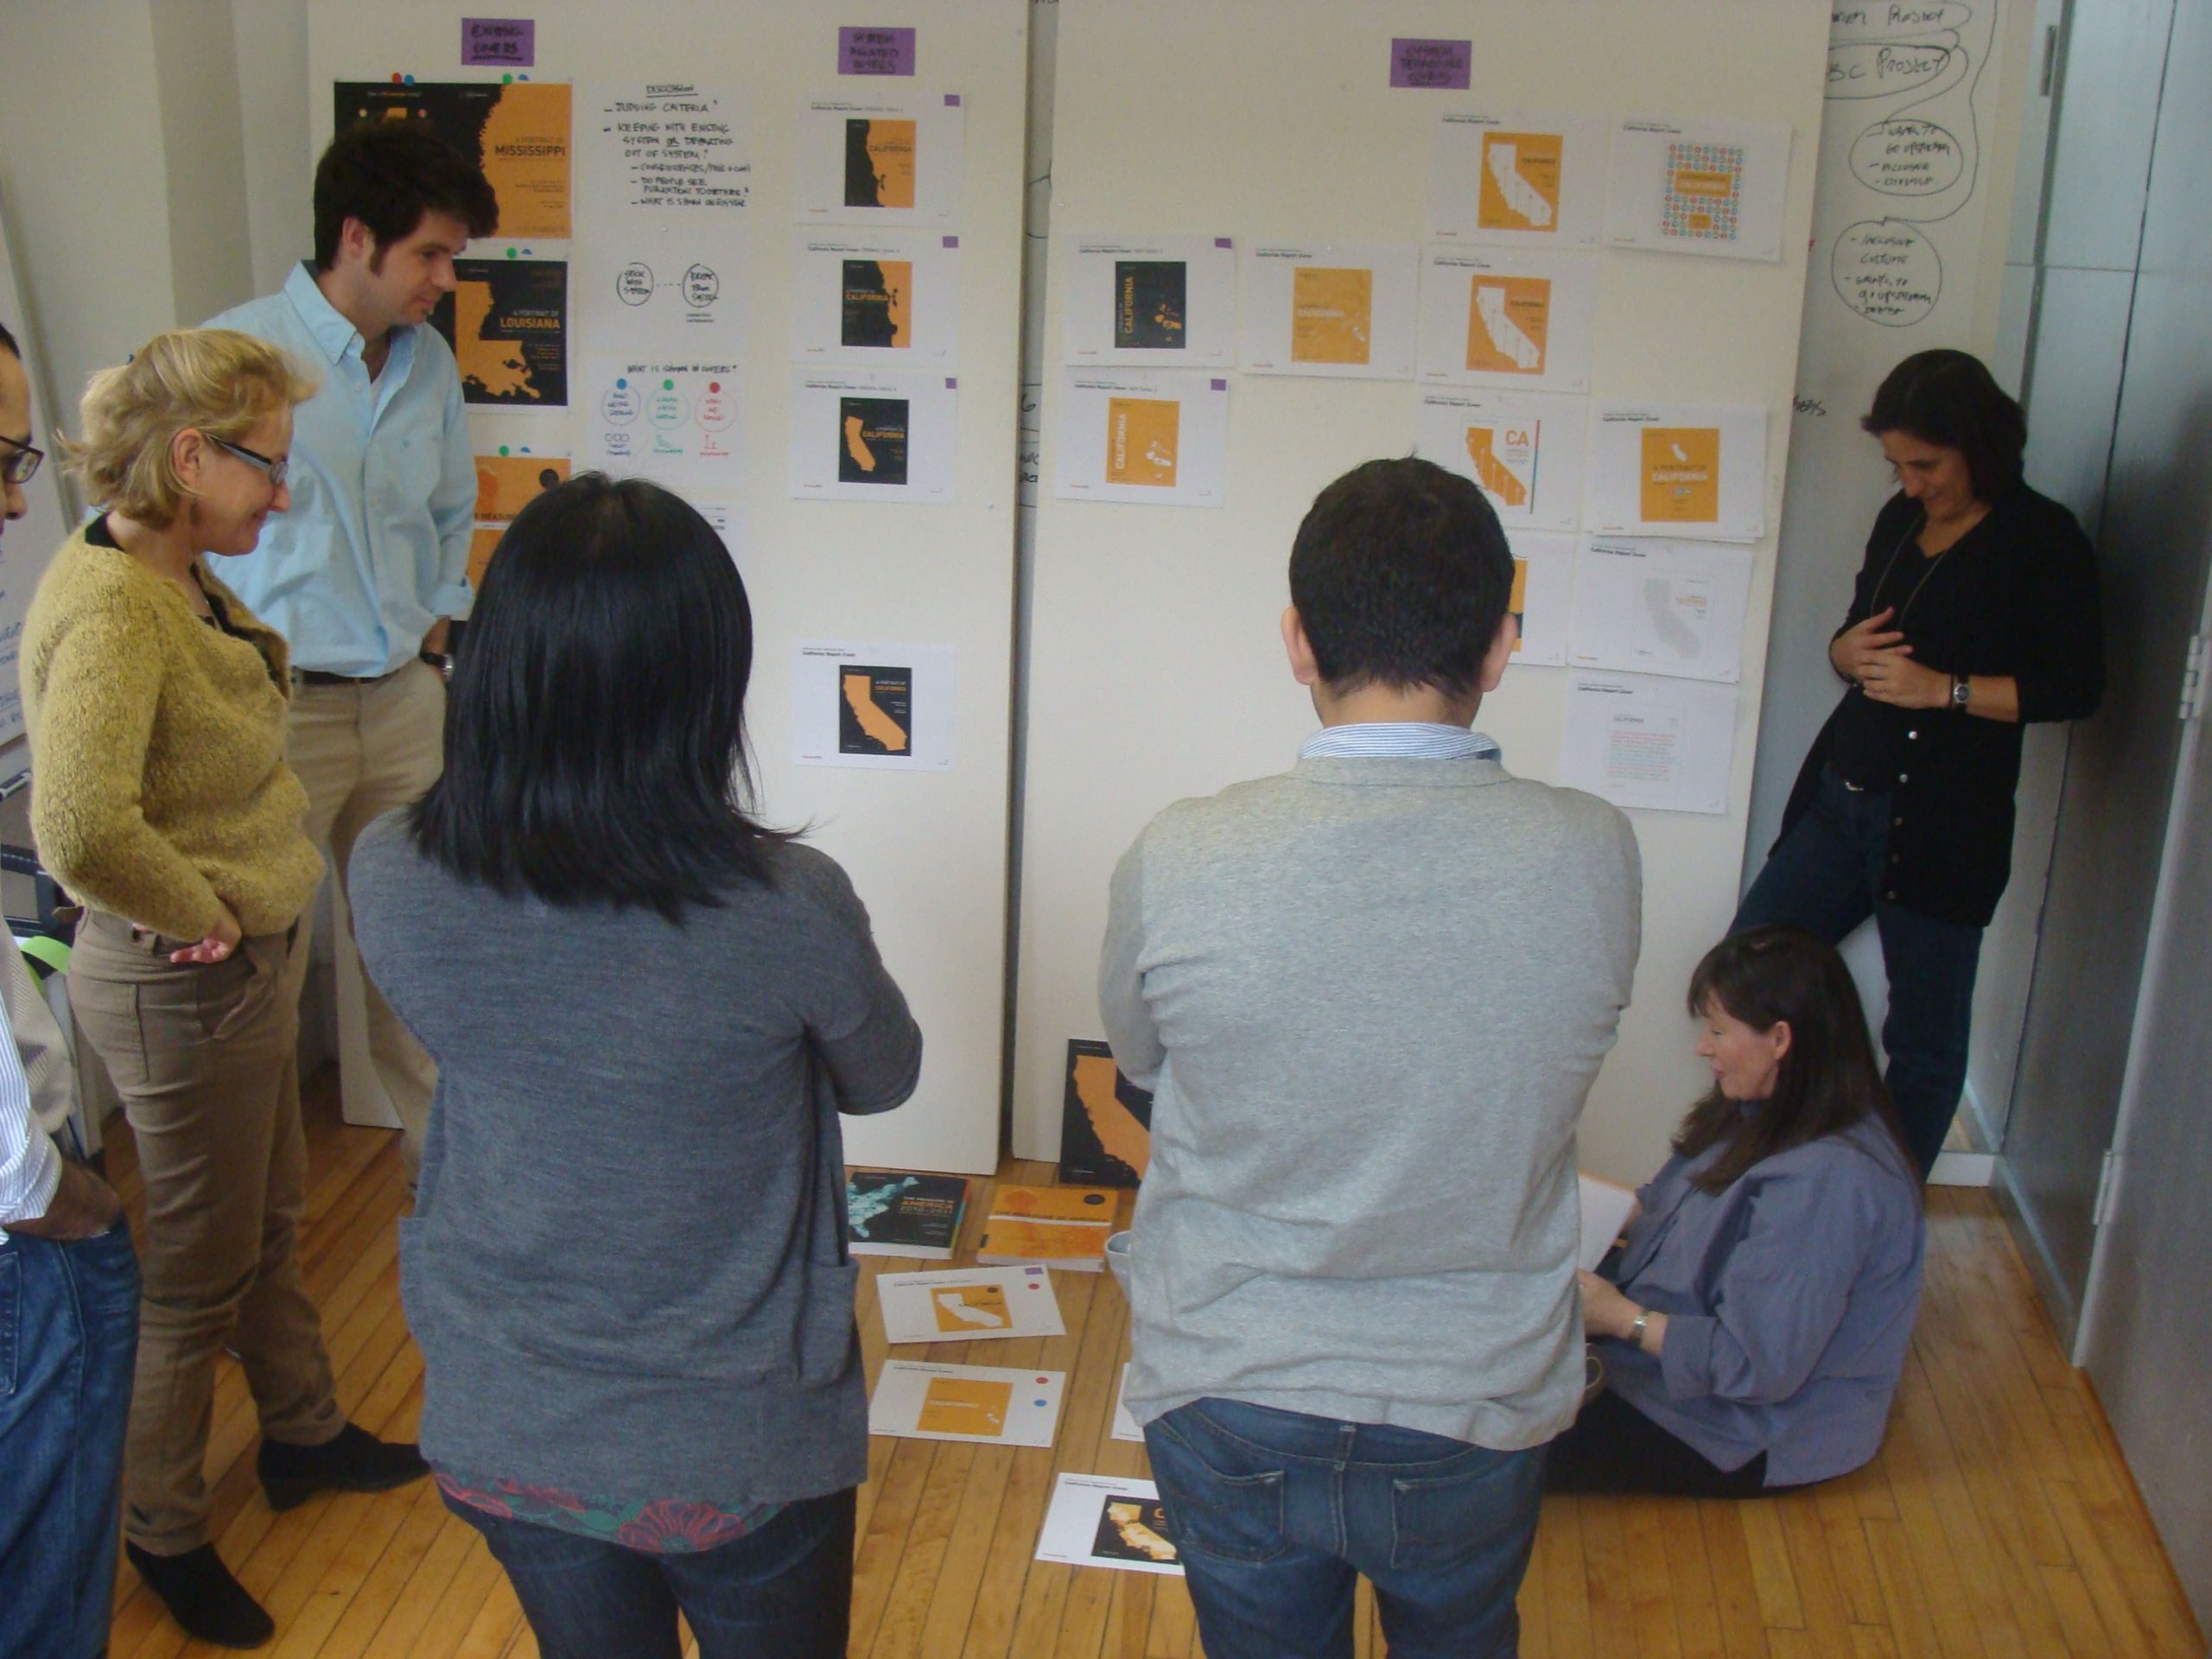
We knew that to break into the crowded marketplace of ideas around social and economic progress and equity in the United States, we had to create something unique. A few ideas guided us. First, we hoped to reach people in the middle, so we used neutral framing and language and did not associate our work with any political party. Second, we were keen to use design in a very deliberate way—not just to make our reports look pretty but also to facilitate understanding of complex issues—and we worked hard to find information designers who shared this vision. Those first designers, Elizabeth Pastor and Garry VanPatter of Humantific, are still our partners today. Finally, we wanted to connect the numbers to the actual people those numbers represented—to humanize the data.
What have we learned over the past ten years about what makes a project successful? A decade of experience has taught us doing the following is vital:

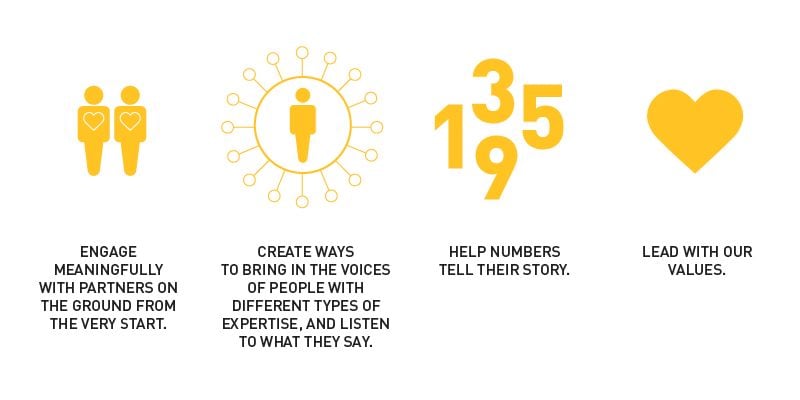
Engage meaningfully with partners on the ground from the very start.
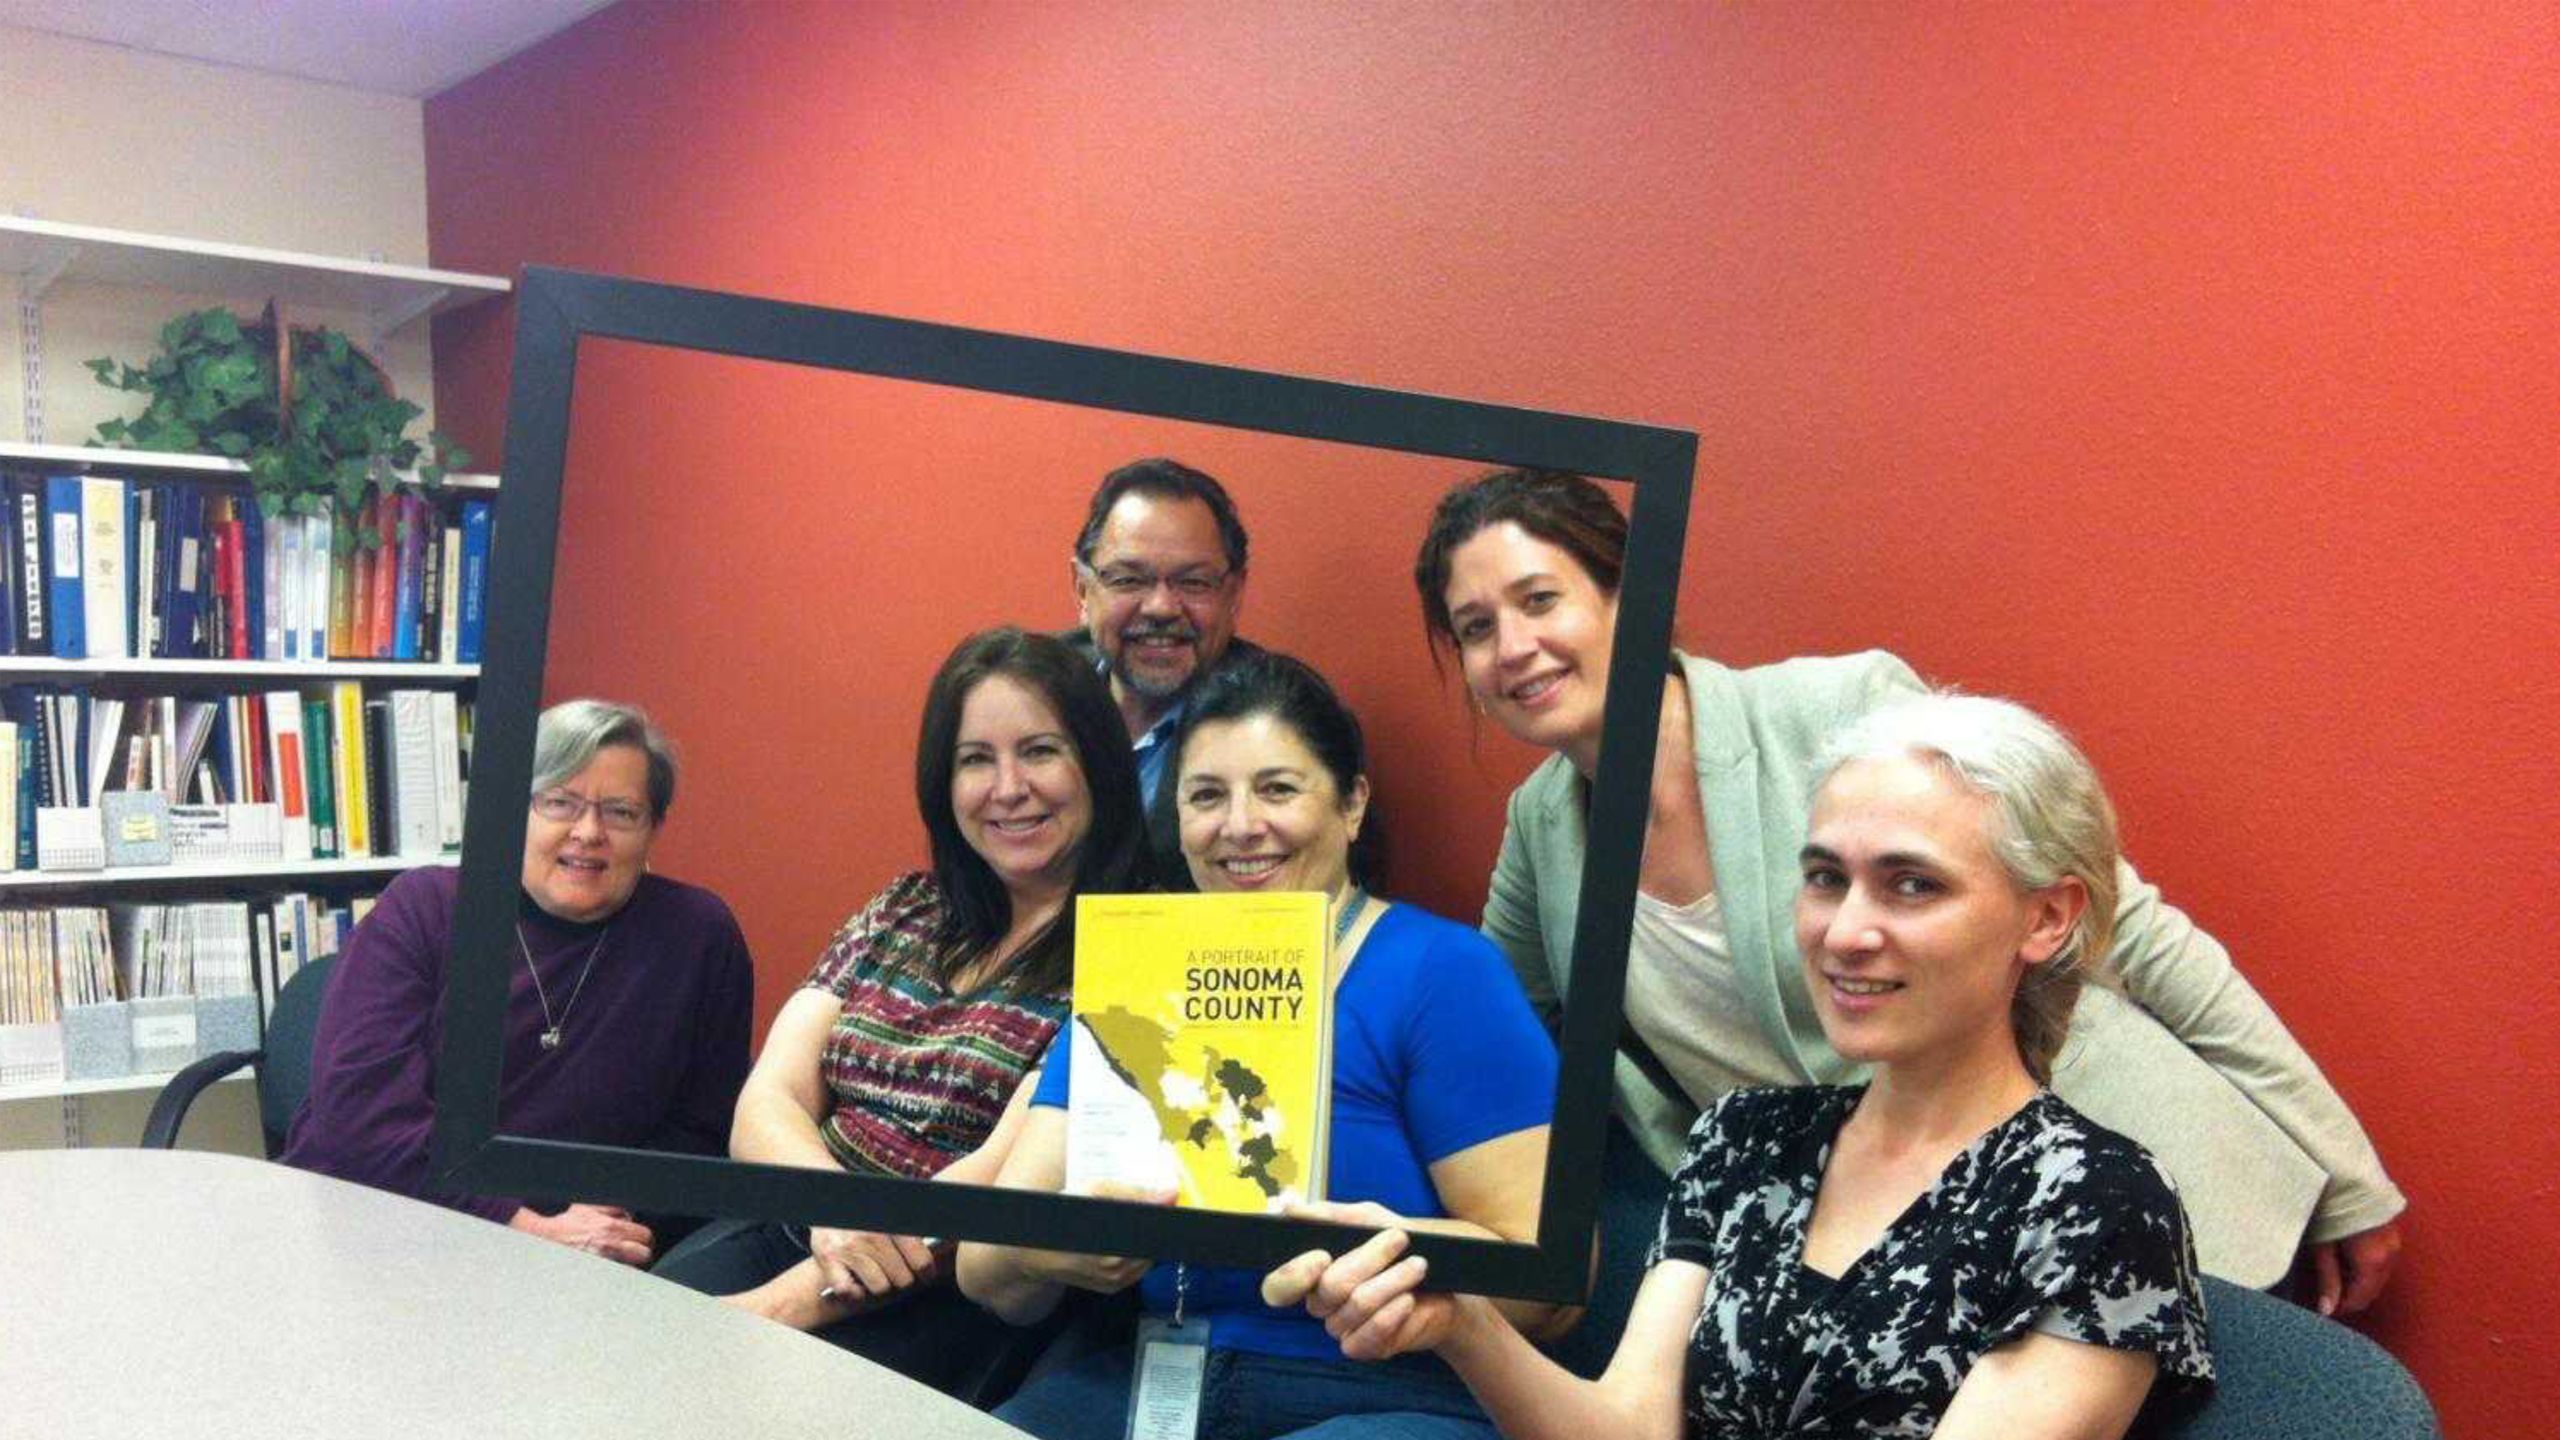
We could create online tools, conduct research, and write reports sitting alone in our offices. But tools and reports created in a vacuum are seldom used. Working closely with one or more well-respected, effective organizations is critical. Such organizations are vital in shaping reports and online tools by helping us identify key issues, understand the unique local context, access local data, understand which recommendations are most likely to gain traction and make a difference, and carry those recommendations forward after the project is complete. For our recent A Portrait of Los Angeles County, we not only received funding from a consortium of fifteen local foundations, but also rooted the work in a partnership with the Southern California Grant makers and three LA County departments to ensure that the report would reflect the lived realities of Angelenos.
Create ways to bring in the voices of people with different types of expertise, and listen to what they say.
Measure of America not only has a National Advisory Committee of leading thinkers and doers to guide us in all our work, but also constitutes advisory bodies of various sorts for each and every project we do. For A Portrait of Los Angeles County, for example, we benefited from the views of advisory committees that brought together more than 200 people, including scholars, policymakers, LA County staff, advocates, service providers, and community group representatives. We try to bring in people and groups with very different points of view and we work to create spaces where contrasting perspectives can be expressed and heard respectfully. Our multi-stakeholder engagement methodology is one of our greatest strengths.
Help numbers tell their story.
When we started Measure of America, we were naively optimistic about the power of data to change people’s minds and motivate action. But numbers alone—even shocking ones—don’t make change; people, organizations, and collective action do. So how can we move from data to action? Data need to be made accessible, put into context, embedded in an explanatory framework, and tied to the lives of real people. Helping numbers tell their story is now a big part of what we do at Measure of America.
Lead with our values.
The human development approach is not a value-free framework. On the contrary, it values above all human freedom and dignity and holds that a good life is a life of genuine choice. It is about people’s ability to decide for themselves who to be and what to do and prioritizes, in the words of the UN Human Development Report office, “expanding the richness of human life, rather than simply the richness of the economy in which human beings live.” We care about research and data because of their power to help those striving to make our communities better—fairer and freer, more equitable and inclusive. Being clear about our values as well as our skills helps us connect with partners whose vision of a better world we share.
-Kristen Lewis, Director of Measure of America


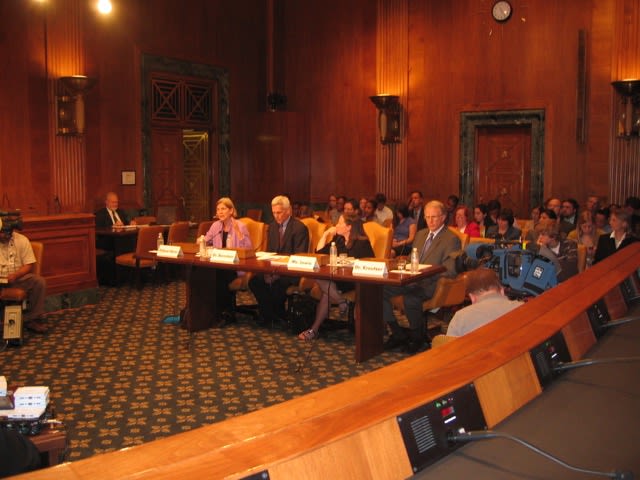
Kristen Lewis testifies alongside then-Harvard Law professor, now-Senator Elizabeth Warren, Jared Bernstein of the Economic Policy Institute, and David Kreutzer of Heritage Foundation at a hearing entitled "How Much More Can American Families Be Squeezed By Stagnant Wages, Skyrocketing Household Costs, And Falling Home Prices?" called by Chairperson Charles Schumer of the Joint Economic Committee.
Kristen Lewis testifies alongside then-Harvard Law professor, now-Senator Elizabeth Warren, Jared Bernstein of the Economic Policy Institute, and David Kreutzer of Heritage Foundation at a hearing entitled "How Much More Can American Families Be Squeezed By Stagnant Wages, Skyrocketing Household Costs, And Falling Home Prices?" called by Chairperson Charles Schumer of the Joint Economic Committee.

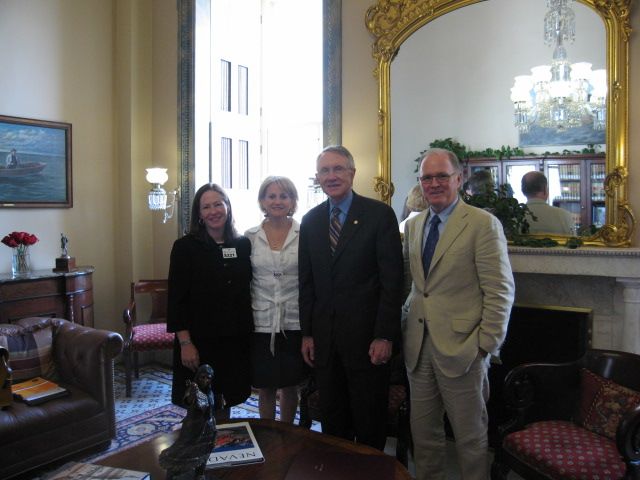
Kristen Lewis, Sarah Burd-Sharps, and Hilton Foundation Vice President Ed Cain discuss the American HDI with then-Senate Majority Leader Harry Reid shortly after the launch of the first Measure of America report in 2008.
Kristen Lewis, Sarah Burd-Sharps, and Hilton Foundation Vice President Ed Cain discuss the American HDI with then-Senate Majority Leader Harry Reid shortly after the launch of the first Measure of America report in 2008.
Measure of America Today
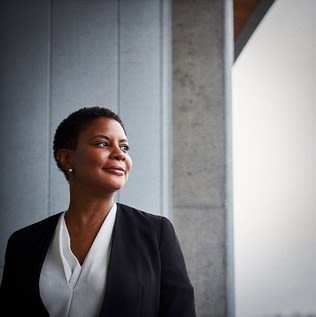
Today, Measure of America is a project of the Social Science Research Council (SSRC), a nearly century-old organization dedicated to mobilizing knowledge for the public good. The president of SSRC is Alondra Nelson, a scholar of science, technology, and social inequality and professor of sociology at Columbia University.
Measure of America breathes life into numbers to stimulate fact-based dialogue and evidence-based policymaking to improve well-being and reduce disparities. We work with a wide range of partners to measure what matters for people’s lives, presenting data and analysis in lively, accessible ways through human development reports, intuitive online data tools, infographics, and research briefs. We believe that everyone deserves the chance to live a freely chosen, flourishing life.
We are guided in our work by a trusted National Advisory Committee of leading thinkers and doers.

Measure of America National Advisory Committee
Paul Brest | Professor of Law, Emeritus Stanford Law School
Jeanne Brooks‐Gunn | Virginia and Leonard Marx Professor of Child Development & Education; Co‐director, National Center for Children and Families Columbia University’s Teachers College
Edmund J. Cain | Vice President, Grant Programs Conrad N. Hilton Foundation
Prudence L. Carter | Dean and Professor, Graduate School of Education University of California, Berkeley
Flora Castillo | Board Member NJ TRANSIT Board of Directors
Dalton Conley | Henry Putnam University Professor in Sociology Princeton University
Nicholas Eberstadt | Henry Wendt Chair in Political Economy American Enterprise Institute
Gail Gershon | Executive Director for Community Leadership Gap Inc.
James Jackson | Daniel Katz Distinguished University Professor of Psychology University of Michigan
Ellen Levy | Managing Director Silicon Valley Connect
Mignon R. Moore | Associate Professor of Sociology, Barnard College
Evan Paul | Vice President, Products, GuideStar
Patrick Sharkey | Professor, Chair of Sociology Department New York University


“Measuring America: 10 Years and Counting” mobilizes social science for the public good, which is the mission of the Council.” -Alondra Neslon, SSRC President
“Measuring America: 10 Years and Counting” mobilizes social science for the public good, which is the mission of the Council.” -Alondra Neslon, SSRC President

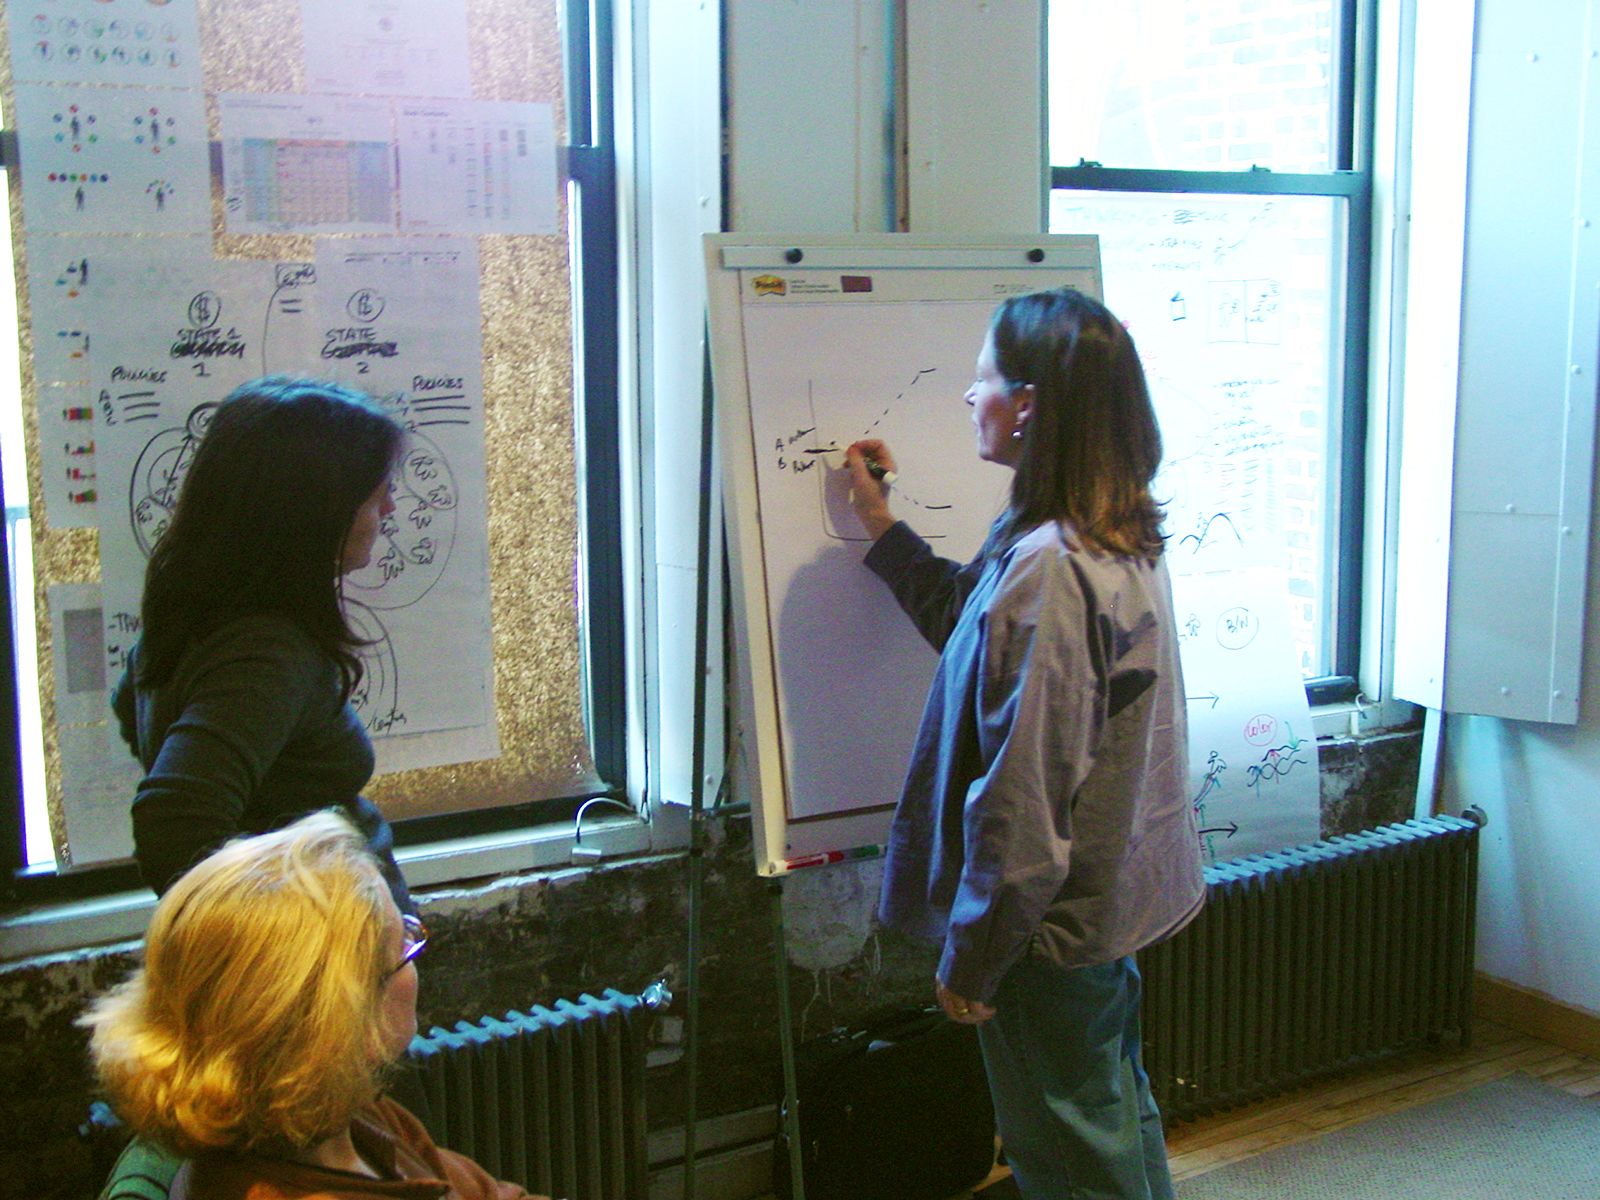
ROLE OF DESIGN IN OUR WORK
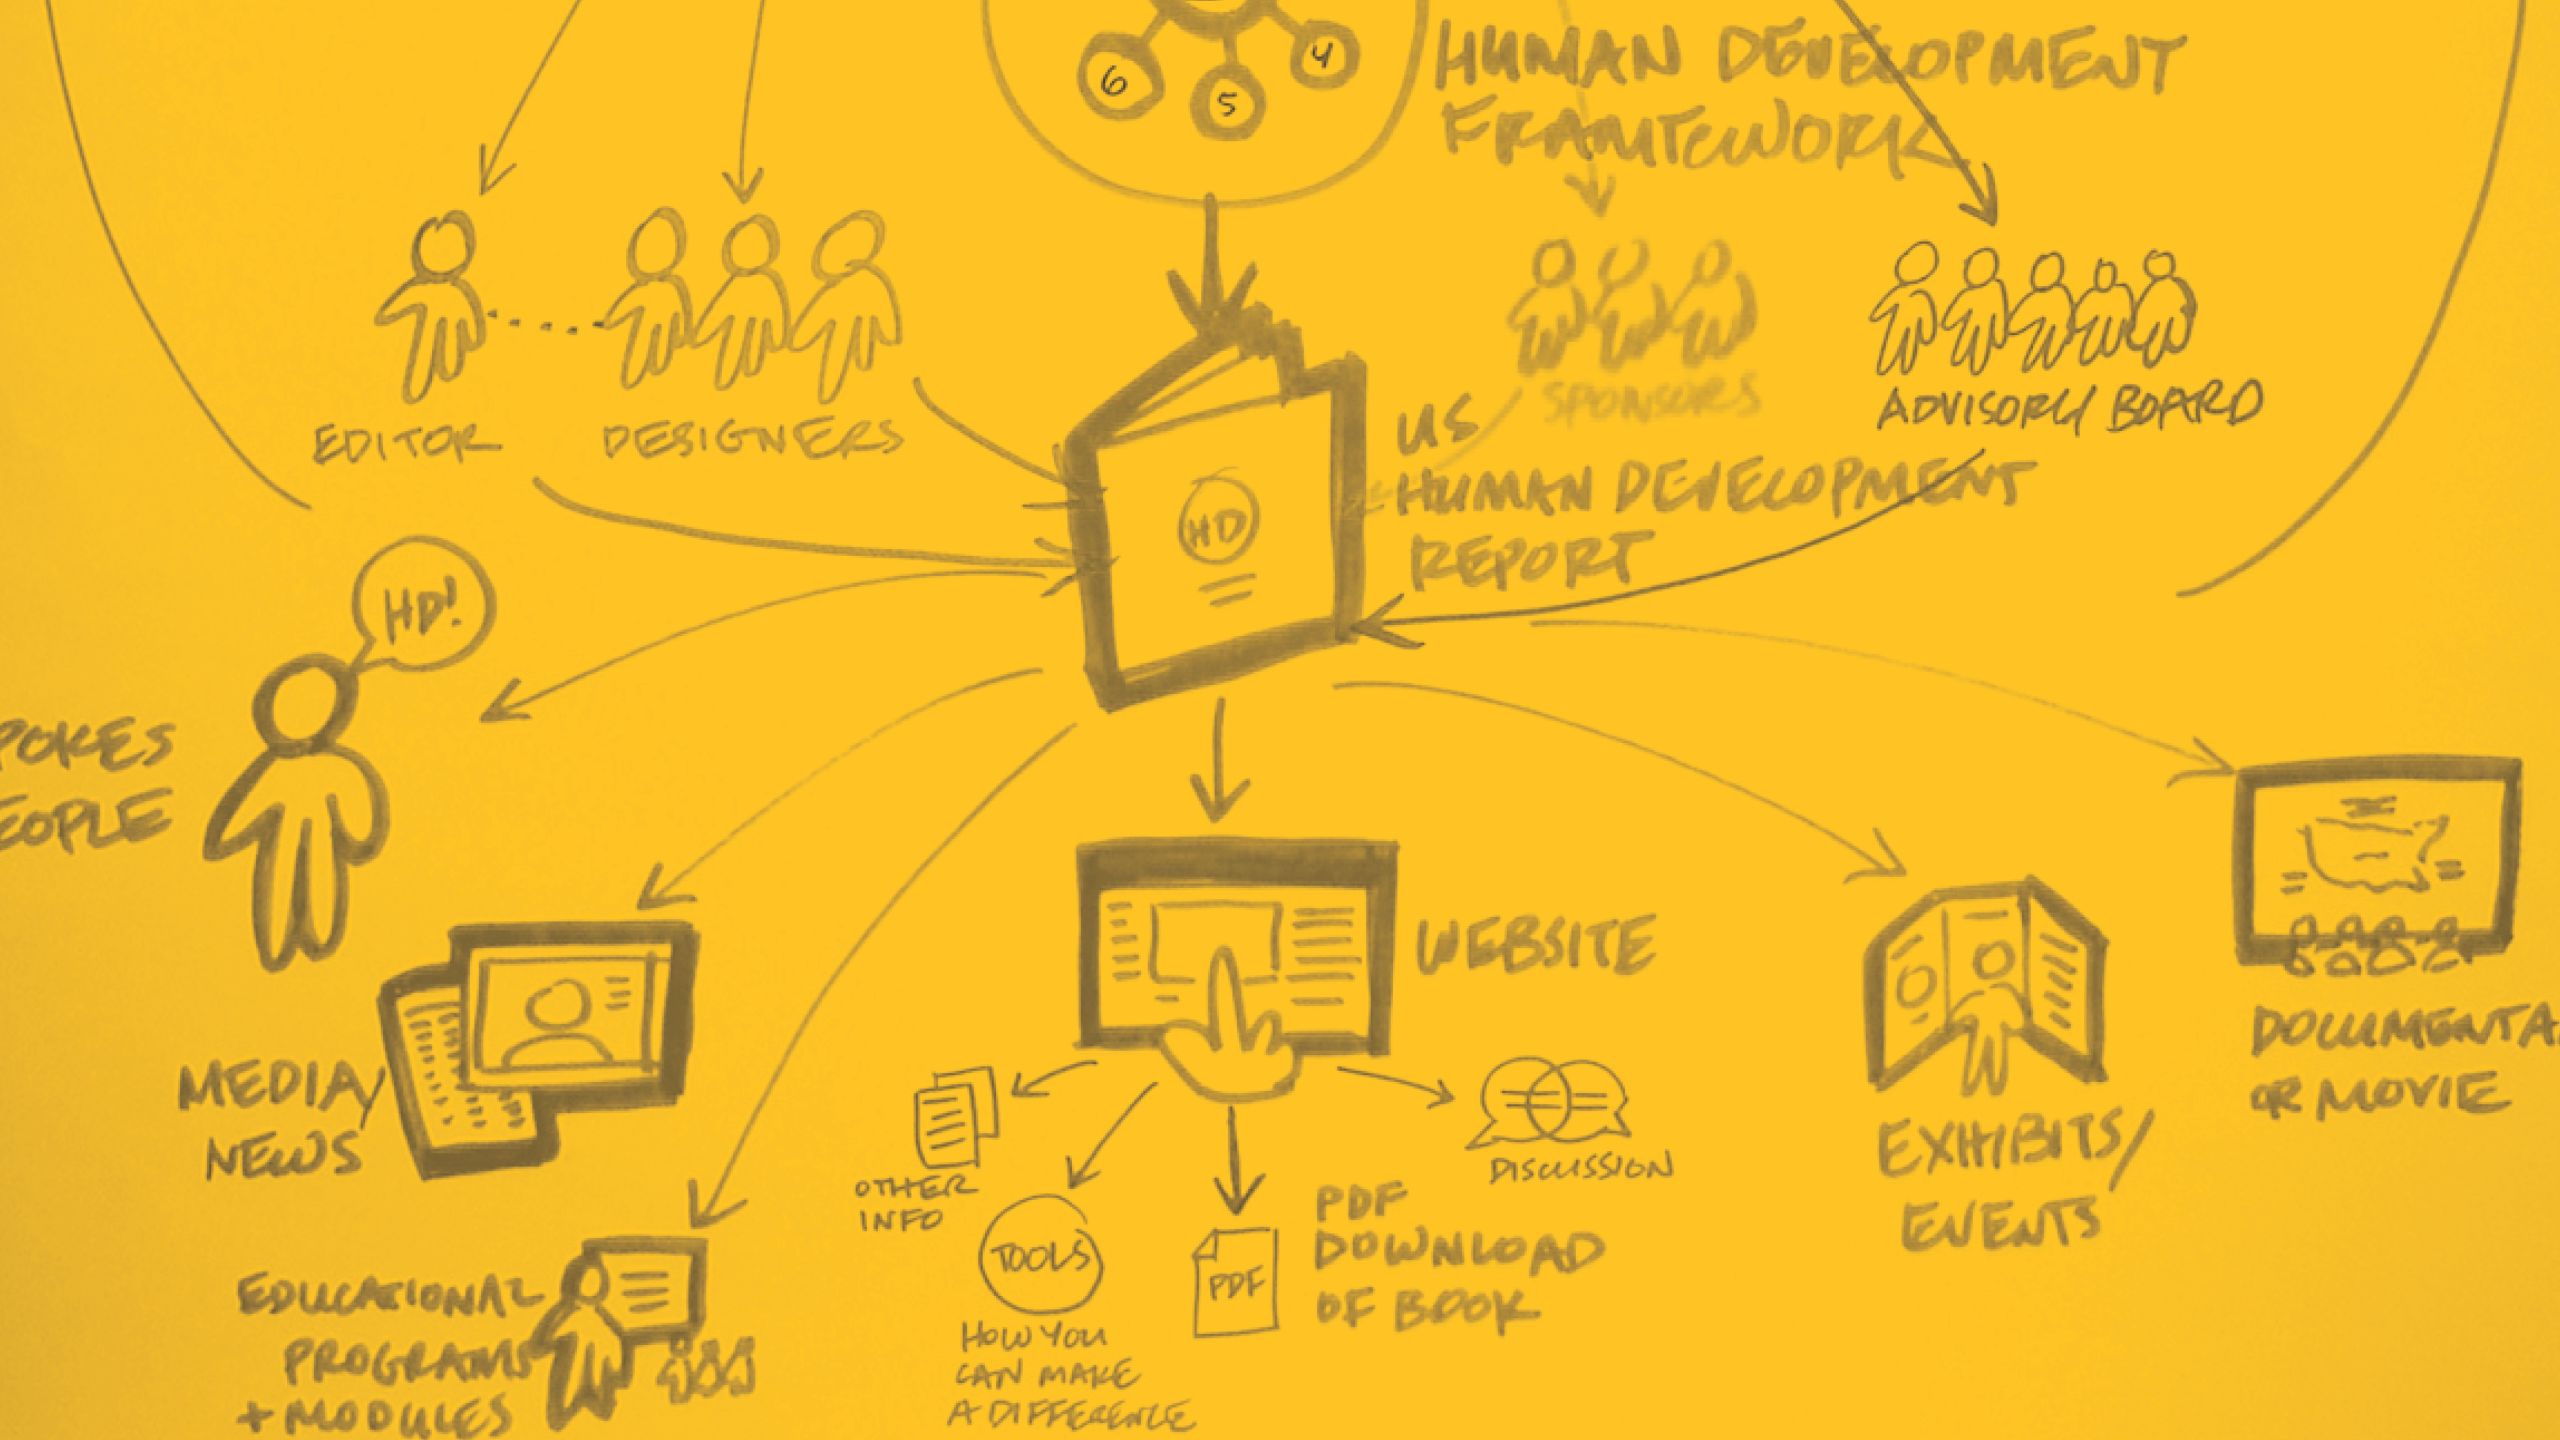
From the very beginning, we knew we wanted to use design to help readers make sense of the human development concept, of the often complex social and economic issues we were discussing, and, especially, of the vast sea of numbers we were grappling with—from the get-go, each of our reports was chockablock with data. We cared a lot about aesthetics, but our top priority was to use design to foster conceptual understanding, help readers easily grasp our main points, and guide people through the maze of numbers—all with a view to producing work that could support real change. Design has always been fundamental to the way we translate data into knowledge.
So it was clear that we needed designers who cared about bringing ideas and words to life, not just making the report look lovely. We found those designers in Elizabeth Pastor and Garry VanPatter, the founders of Humantific, our partners and friends for over a decade. Building on pioneering early design methods such as Isotype (International System of Typographic Picture Education), which originated in Europe in the 1920s, Elizabeth and Garry worked with us to create the visual language that ties together all our reports, a clear, easy-to-follow system that is fun but rigorous and which is appealing and useful to different types of audiences.
Listen to Kristen and Elizabeth discuss the role of design in our work!
Listen to Kristen and Elizabeth discuss the role of design in our work!
The most amazing thing about working with Elizabeth and Garry has been the way in which the words we had on paper became so much clearer, so much better organized, and so much more vivid through the process of representing them visually. It was the first time we came across designers who actually read the words, thought deeply about what they really meant, and came back to us and asked, “What are you actually trying to say here?” They found inconsistencies and areas where our thinking was addled and muddy. By pushing us all the time to get our thinking straight, they helped us to sharpen our messages. Humantific also encouraged us to think about the big picture and remember what we were trying to do, which was not just to write a book, but to put something out there that would provoke discussion and change.
Drawing a picture to illustrate a point seems so simple, but it took a lot of conversation, a lot of back and forth, a lot of words to get to the right image. For people who understand things visually better than they do in terms of words, this work is essential.
Over the last decade, we have continued to work together to build upon the design foundation established in our first book. We still use the same color navigation system and foundational infographics, such as the HD Index calculator, that we created in the beginning. But we have added new ways of visualizing people and ideas and refined the ways in which we present data. We use the same visual language, but freshen up the design with new elements each time.
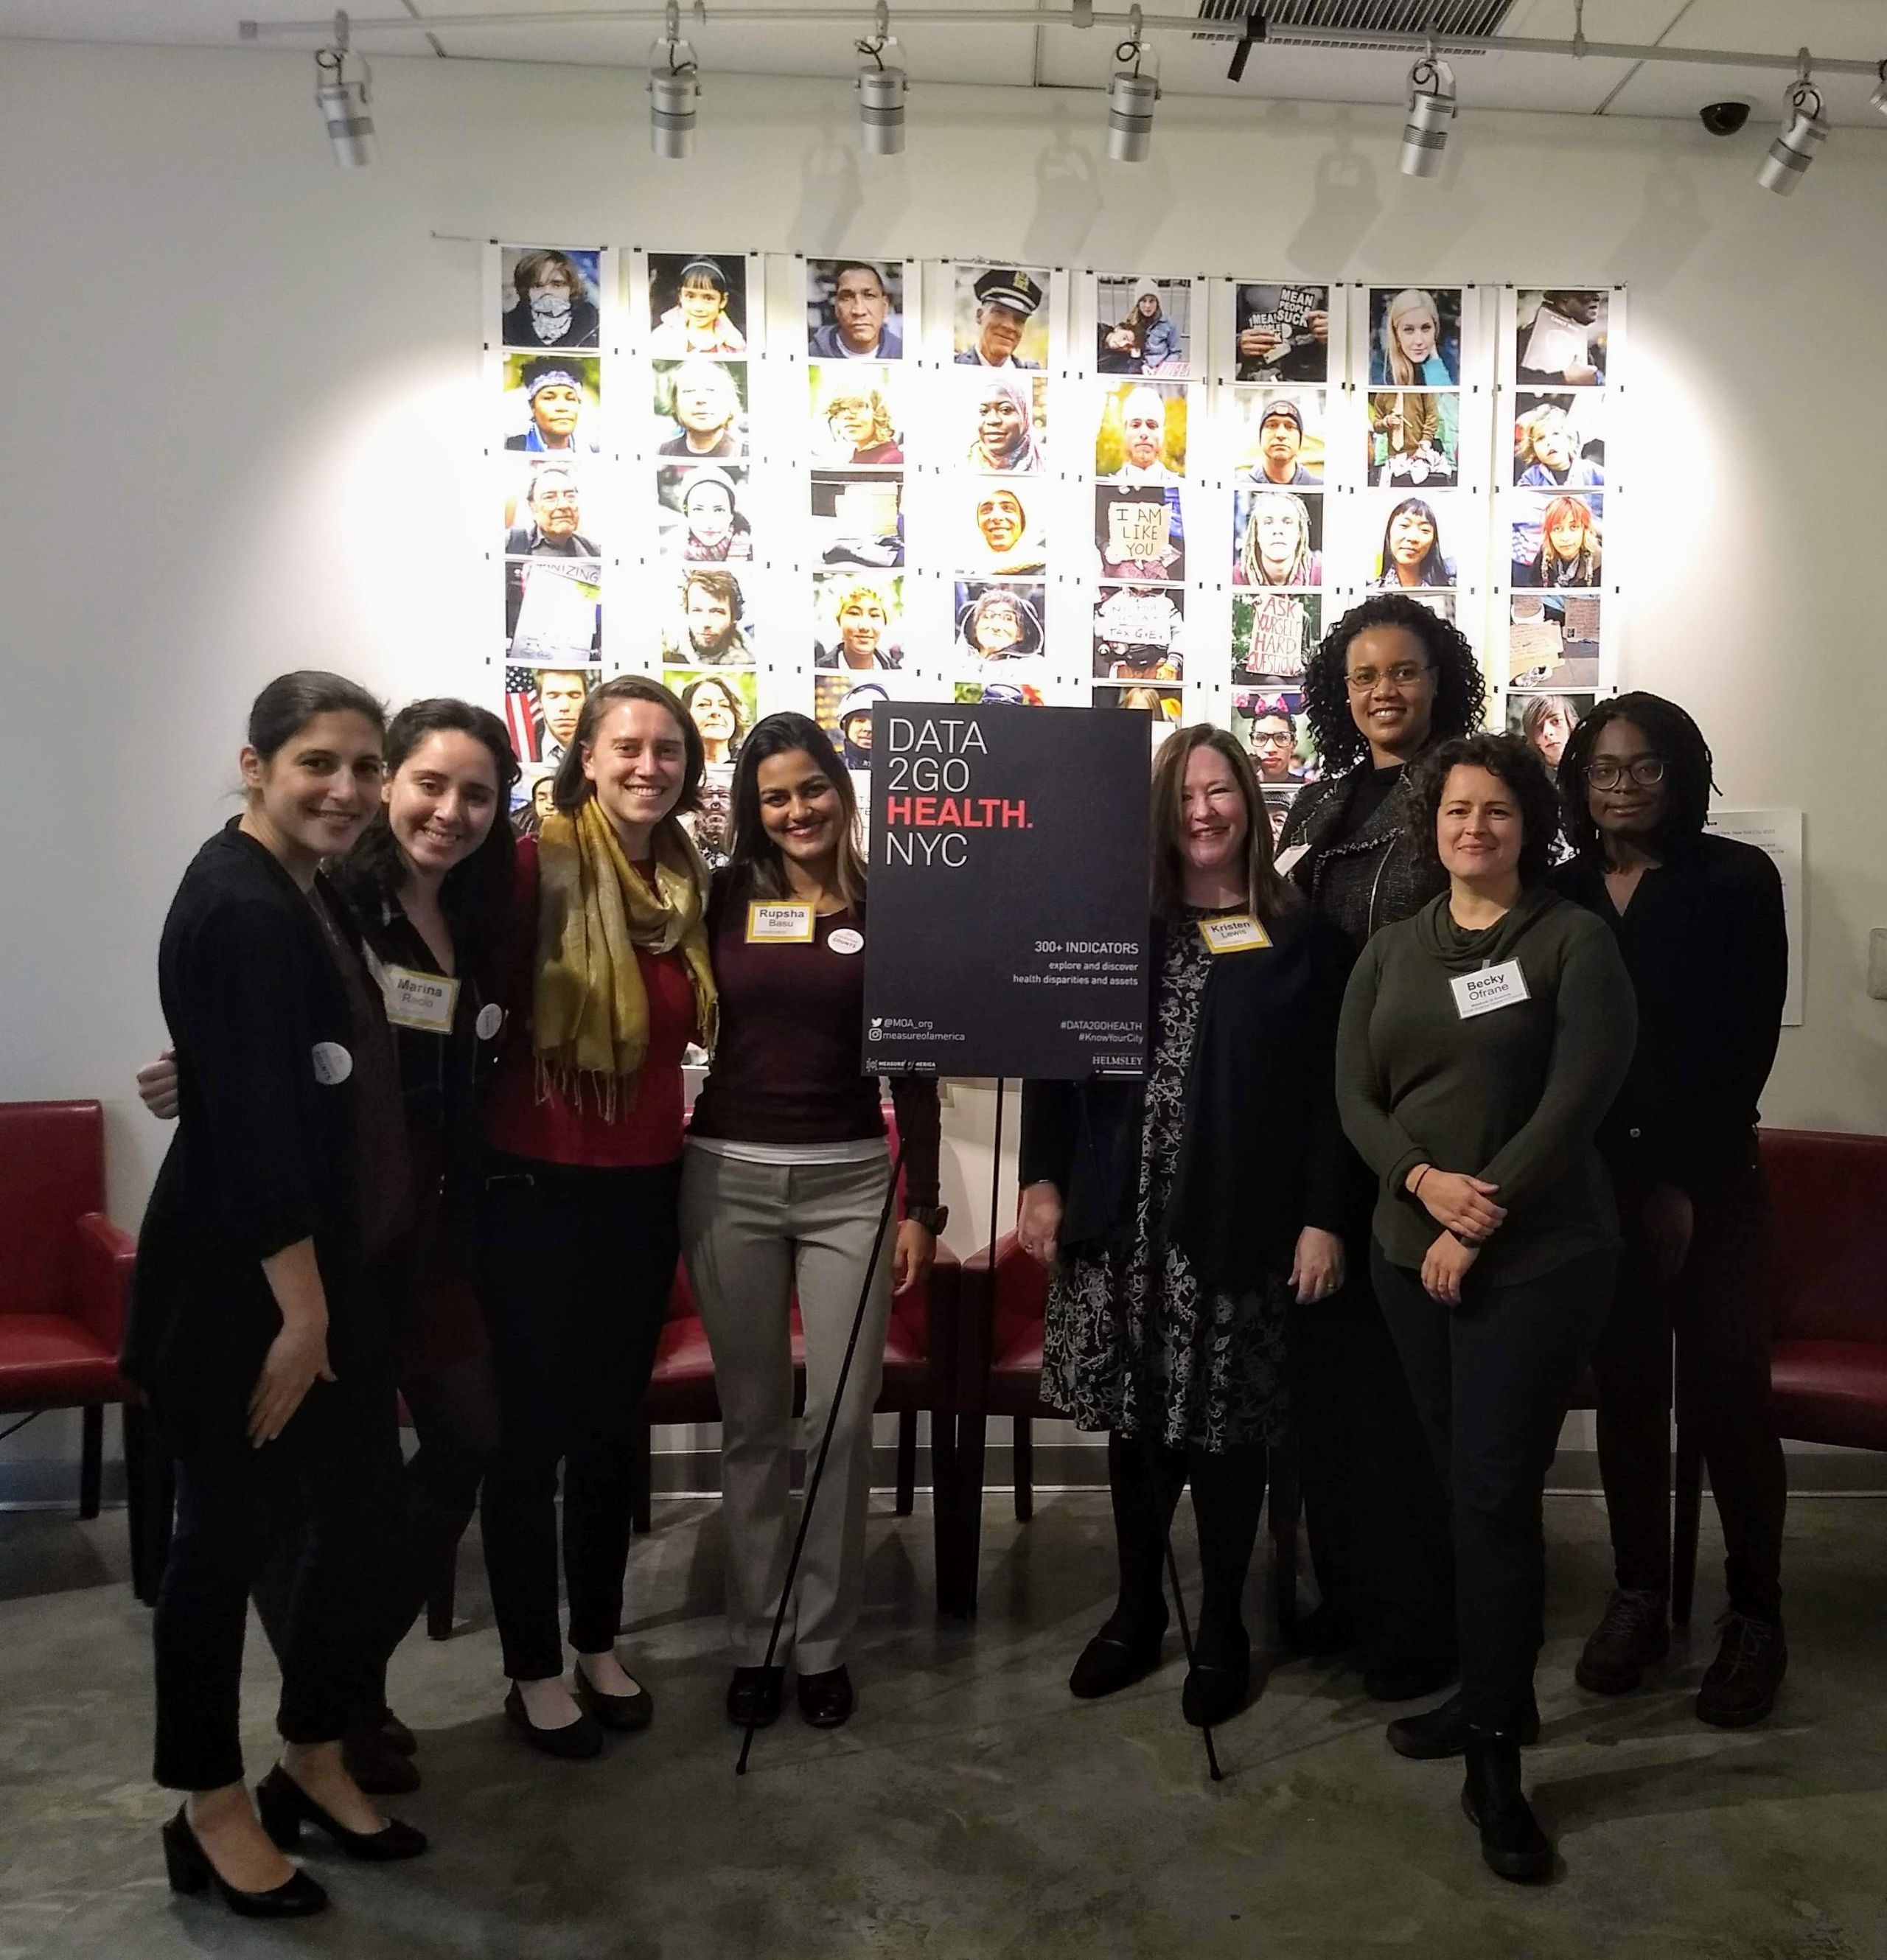
Design has likewise been fundamental to our online tools, such as DATA2GO.NYC and DATA2GOHEALTH.NYC. We have worked with designer, writer, and educator Rosten Woo to create tools that are accessible, intuitive, and fun and give users the information they need in a form that makes sense. As in our books and reports, design is used to create meaning and help users navigate the data as well as to create something beautiful.
10 YEARS
OUR IMPACT


UNLEASHING THE POWER OF DATA

United Ways of California (UWC) is committed to using Measure of America’s American Human Development Index to advance opportunities in health, education, and financial stability for every person in every community. Henry Gascon, director of program and policy development at UWC, says that using Measure of America’s data and reports helps UWC understand “how low-income families are actually doing, accounting for measures that the federal poverty line ignores.” United Way branches across the state have launched initiatives that target issues highlighted in Measure of America’s two Portrait of California reports (2011 and 2014). For UWC, a more comprehensive understanding allows for a more comprehensive approach.
DATA2GO.NYC STRENGTHENING
CIVIC ENGAGEMENT

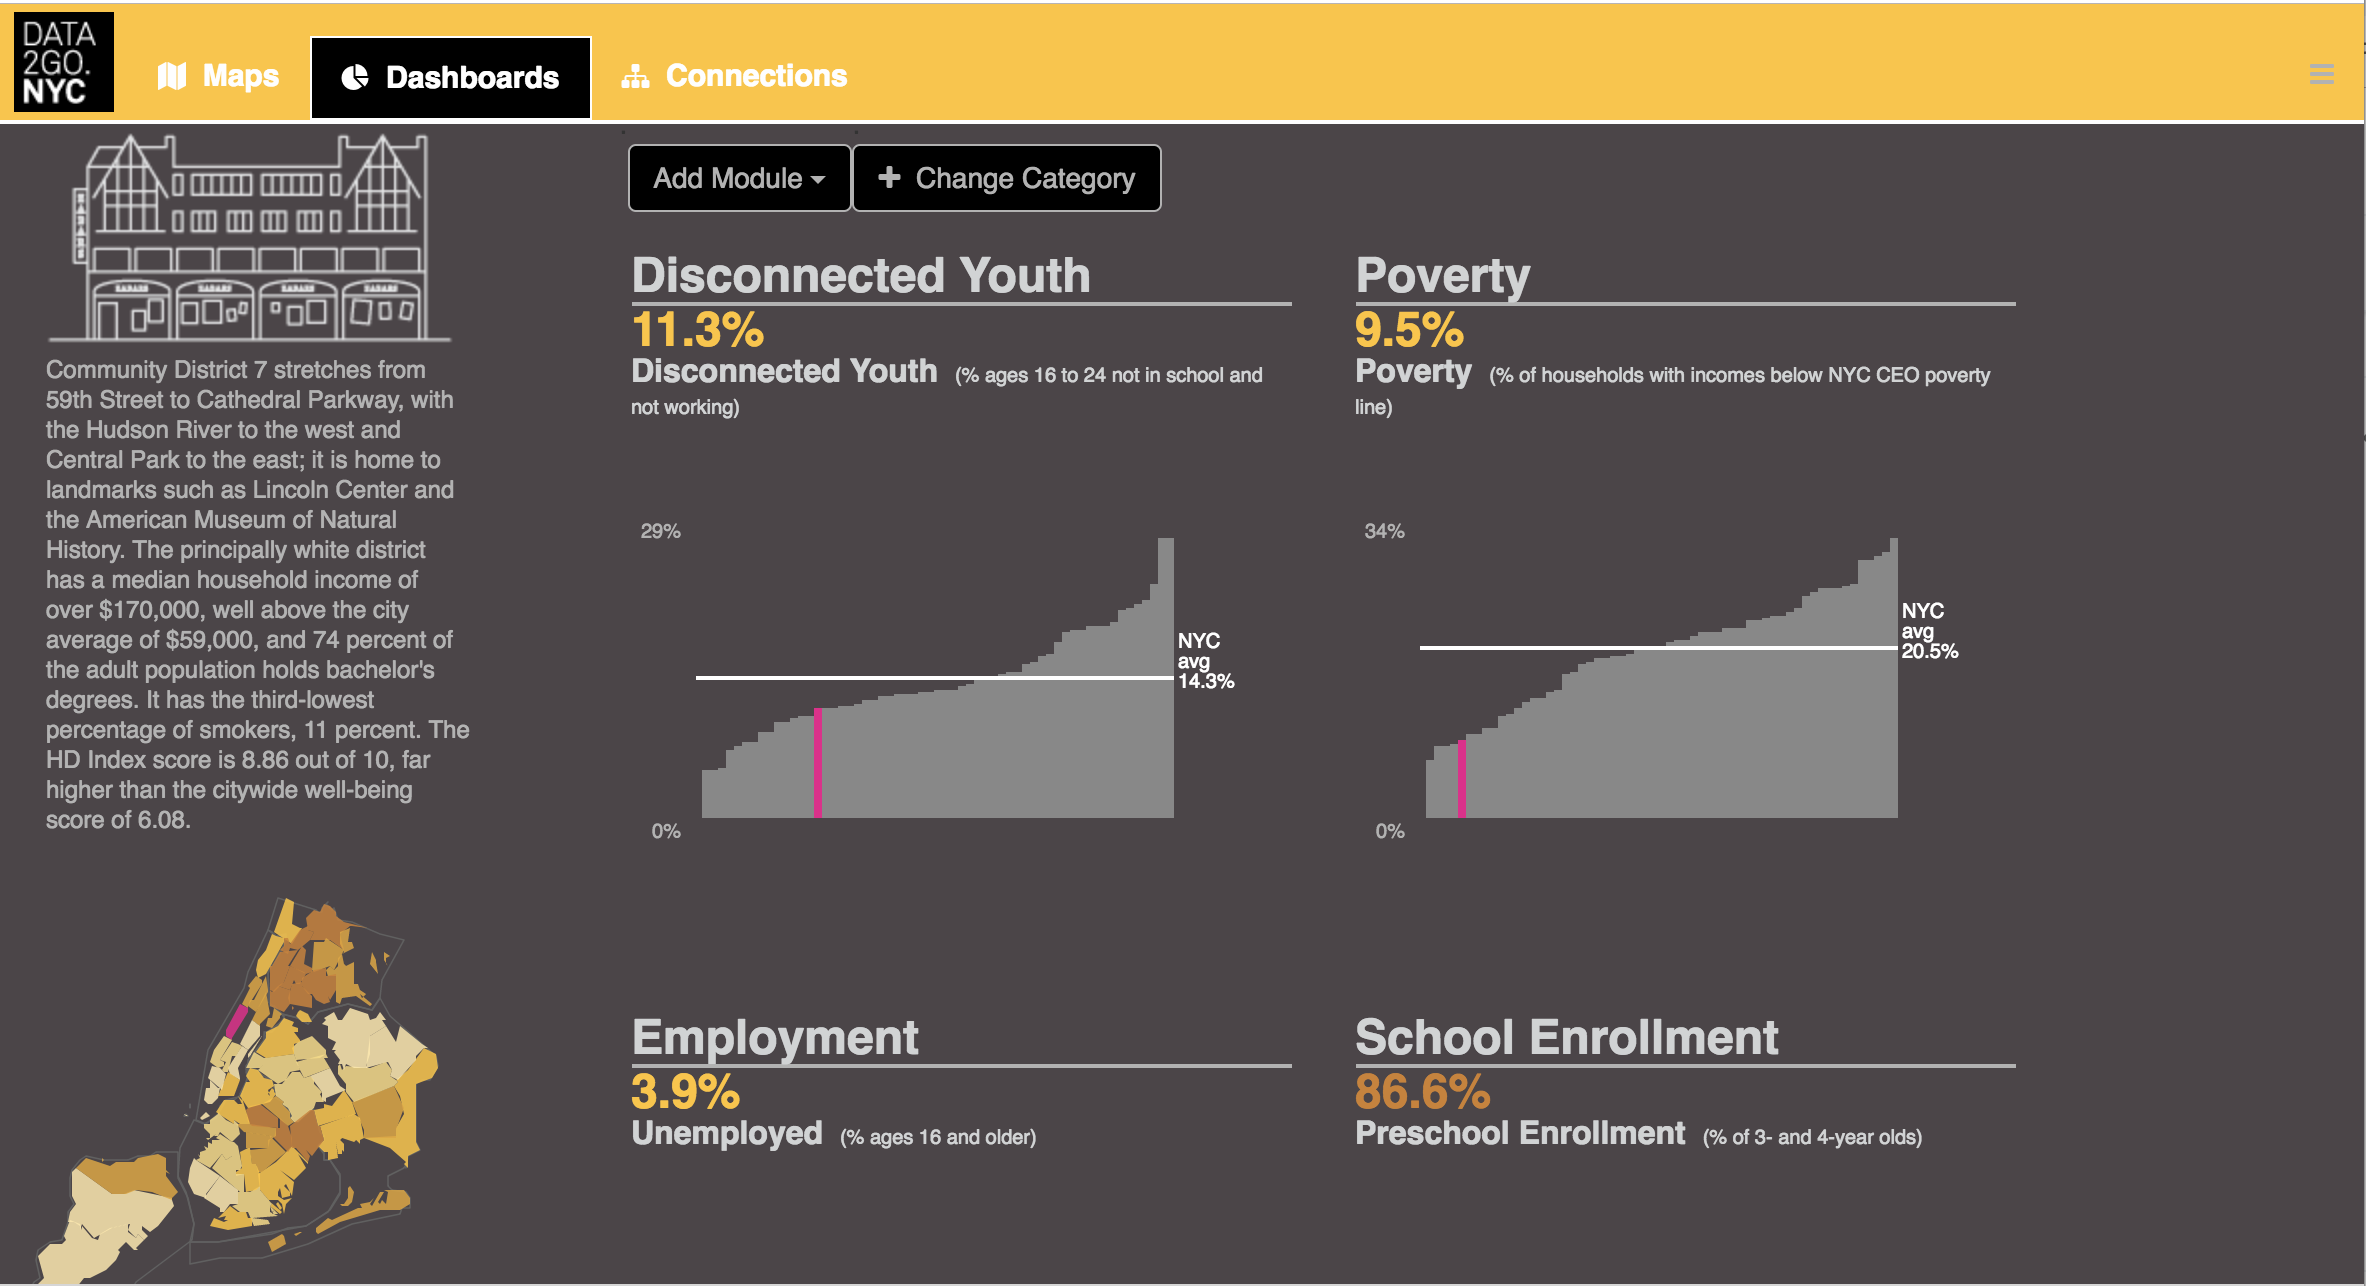
South Bronx Rising Together, a community-wide effort that brings together a network of neighborhood residents and program providers to build pathways of success for children and youth “from cradle through college and career,” is creating a common agenda to inform community-led change in Bronx Community District 3. DATA2GO.NYC has proved to be an invaluable tool for this collective-impact project, and Measure of America helped South Bronx Rising Together develop shared metrics.
Veronica Cuellar, data manager at South Bronx Rising Together, uses the DATA2GO.NYC map on the fly when working with community members in meetings and in her office. She says, “I don’t like when people ask a question and we don’t have an answer… DATA2GO is definitely one of those tabs that I don’t close on my phone.” One of Cuellar’s goals is to increase data literacy among the residents and communities she works with, and DATA2GO.NYC helps people find the answers they are looking for themselves. Further more, Cuellar argues, when you invite community residents to be part of the analysis and decision-making, they become more effective in contributing to community change and can continue the work even after you are gone.
For data experts and novices alike, DATA2GO.NYC is a tool that provides open access to New York City population and community-level data in an easy-to-use, accessible, and all-inclusive format. DATA2GO.NYC enables users to pinpoint particular groups and areas in need, craft solutions, target policies and services, track progress, and advocate for change.
HARNESSING DATA FOR
COMMUNITY CHANGE


In 2017, Manhattan’s Community Board 1 embarked on creating a Livability Index for their district. Their Department of Planning and Land Use set out to identify the many factors that affect the quality of life for Community Board 1 residents.
Community Board 1 compiled a tremendous report of over 120 features, such as physician availability, school safety, prevalence of grocery stores, and internet access.In order to develop such an impressive index, DATA2GO.NYC proved to be indispensable. As Diana Switaj, director of planning and land use, says, “It’s so user friendly. It’s a really great source for a snapshot for whatever data point you’re looking for.” In the Livability Study alone, Measure of America’s data was used thirty-one times.
With this comprehensive report in hand, members of Community Board 1 were able to get a sense of overall livability for the district, the areas that could use improvement, and how these data can translate into actionable changes. Switaj says that DATA2GO.NYC numbers add weight to anecdotal evidence on matters such as air quality and noise pollution: “It just provided so much data for that and it’s just so easy to use.”
Community Board 1 will likely return to DATA2GO.NYC for future livability studies. As Switaj said, “The idea is that we would have a methodology set up so it could periodically be updated… tracking it over time is really useful.”
LOOKING AHEAD
THE FUTURE


THE Next Ten Years
Although Measure of America has been consistent in the way in which we have calculated and deployed the American Human Development Index, the last decade has seen many innovations. Thanks to greater data availability, we are increasingly able to calculate index values for Asian and Latino subgroups and for US- and foreign-born residents. We have opened up an important line of research and advocacy around youth disconnection, and our annual calculations of the youth disconnection rate for different groups and geographies are an important source of information for the field. Our work with organizations on the ground is much broader and deeper today than it was when we began; our approach to stakeholder engagement, community involvement, and co-creation is now among our greatest strengths. Our online presence has vastly expanded, from a simple map to display HD Index scores for states in 2008 to a suite of online tools that includes an updated national map and locally focused tools like DATA2GO.NYC, DATA2GOHEALTH.NYC, and Cottage Data2Go. Our visual language has continued to evolve and our infographics have gotten better.
In the coming decade, we will continue to build on these innovations, and the human development and capabilities approach along with the HD Index will continue to be central to our work exploring inequalities and advocating for people-centered policies to address them. At the same time, we feel compelled to respond to issues that have presented themselves in recent years with a new urgency, namely climate change, societal divisions, and the potential of new technologies to increase inequality. We believe that these issues are ripe for exploration through a human development lens. Thus we anticipate engaging more deliberately with questions of sustainability, social and economic inclusion, and technology and inequality.


Sustainability
Our work here will take two forms. One is supporting cities, counties, and states in setting local goals and tracking progress against the United Nations’ Global Sustainable Development Goals (SDGs), a set of seventeen goals and 169 targets to be achieved in all countries by 2030. The SDGs offer a way to understand and address critical barriers to well-being, economic growth and prosperity, and environmental sustainability in the United States and to put American challenges and opportunities within a global context. The United States played a leading role in negotiating these goals; as a result, they reflect American values and priorities. The spirit behind the SDGs is not just to meet the goals as measured by global or national averages, but rather to spur meaningful action in states and cities, counties and communities. The true aim is meeting the goals everywhere and for everyone. Doing so in the United States will require adapting the global goals in terms of relevant geographic units of analysis (states, metro areas, or counties), population groups (major racial and ethnic groups, women and men, foreign- and US-born residents), and indicators. Mapping America, a tool on our website, features a global goals dashboard for states and counties to help with this endeavor, and we are eager to partner with localities to create sustainable development targets and plans for reaching them.
The second is to build into our work a more systematic analysis of how climate change will affect the well-being as well as choices and opportunities of different groups of Americans. Human development is about expanding people’s capabilities, but it is also about creating human security by protecting the capabilities people already have and building resiliency. Our experience of natural disasters in the US since 2005—from Hurricane Katrina to Superstorm Sandy to the Thomas, Mendocino Complex, Camp, Carr, and Woolsey wildfires that have ravaged California in recent months—is that the people with the fewest capabilities suffer the most from disasters and recover the slowest. Thus the increased frequency and severity of extreme events, from storms to fires to floods, will have serious human development implications for communities across the country, particularly for the most vulnerable within them.
Social and Economic Inclusion
Income inequality measures the extent to which income is distributed in an uneven manner among the population. In the United States, income inequality has been growing for over thirty years. The Great Recession deepened the long standing racial and ethnic wealth divide. The typical white family held a net worth six times greater than the typical black family at the end of the twentieth century. That gap has now doubled to a twelvefold difference. The wealth gap between white and Hispanic households has widened as well.12 As inequality grows, the rungs on the ladder of social mobility grow further apart, making it more difficult for poor Americans, who are disproportionately people of color, to make the climb to the middle class; in addition, as middle-class Americans’ grip on economic security grows more tenuous, they may find themselves slipping down, further slowing the progress of those on the bottom. Many Americans are now shut out—excluded—from the economic bounty and security enjoyed by upper-income families. We will explore this issue in greater depth in future projects.
We also hope to place greater focus on social exclusion. Social exclusion “involves the lack or denial of resources, rights, goods and services, and the inability to participate in the normal relationships and activities, available to the majority of people in a society, whether in economic, social, cultural or political arenas. It affects both the quality of life of individuals and the equity and cohesion of society as a whole.”13 How can we build inclusion both among groups that have long been excluded, such as people of color, people with disabilities, people living in poverty, and LGBTQ people, among others, and people who now voice feelings of exclusion, such as older white people living in rural areas and white men who used to work in manufacturing or mining jobs that have all but evaporated. Feeling a part of society is important to well-being, and evidence is thick on the ground that large segments of society feel alienated: What does that mean for human development?
Technology and Inequality
At the turn of the millennium, the digital age promised the democratization of knowledge and the possibility to reduce or completely do away with human error in decisions. But as our world becomes digitized and algorithms are increasingly the “neutral” agents in decision-making, social scientists warn not only of the limits of technology but also of its potential for justifying, perpetuating, and compounding long-standing inequalities. Mathematician Cathy O’Neil dubs the opaque, biased mathematical models that reinforce discrimination “weapons of math destruction.”14 Marion Fourcade and Kieran Healy warn of a new “economy of moral judgement” where outcomes are determined by data on "prior good actions and good tastes” and painted as morally deserved.15 The potential of technology to improve human lives as well as entrench inequality in new ways will be a larger part of our exploration of inequality in the coming years.
RESOURCES


Click here for a PDF of this report, data tables, and a methodological note.
Thanks to our current team: Becky Ofrane, Brianna Noonan, Jamala Wallace, Kristen Lewis, Laura Laderman, Marina Recio, Rebecca Gluskin, Rupsha Basu, and Vikki Lassiter.
Thanks to our Measure of America alumni: Abby Tremel, Alicia Brindisi, Alex Powers, Ana Carla Costa, Andrew Garon, Anne Vierse, Brendan Mark, Brian Karfunkle, Carly Clemons, Chigozie Akah, Dana Lean-Guerrero, Deeksha Mehta, Dhruv Gandhi, Diana Tung, Dorian Rolston, Eduardo Borges Martins, Emily Bramhall, Eric Henderson, Felix Paquier, Hannah Burd, Ijeoma Amarachi Anyanwu, Jarrett Byrum, Jonathan Cole, Judy Rein, Kevin Kennedy, Kristen Hackett, Lala Xu, Lily Canaan, Louis DeBellis, Matt Herman, Margaret Mattes, Mike Vitoroulis, Namrita Khandelwal, Panka Bencsik, Patrick Guyer, Rebecca Rasch, Sarah Burd-Sharps, Shreya Subramani, Ted Lechterman, Theo Murphy, Thiago Marques, William M. Rogers III, and Yo Jeremijenko.
Thanks to our partners: Humantific, Rosten Woo, Codie See, Group Gordon, Bob Land, and Clare McGranahan.
Thanks to our founding funder: The Conrad N. Hilton Foundation
Thanks to the funder of all our NYC work: The Leona M. and Harry B. Helmsley Charitable Trust
Endnotes
1 Rich, “The Great Recession.”
2 Pfeffer et al., “Wealth Disparities before and after the Great Recession.”
3 US Bureau of Labor Statistics, “Unemployment Rates by Educational Attainment, October 2014.”
4 Mathews et al., “State Variations in Infant Mortality by Race and Hispanic Origin of Mother, 2013–2015.”
5 Cunningham et al., “Vital Signs: Racial Disparities in Age-Specific Mortality Among Blacks or African Americans — United States, 1999–2015.”
6 Murphy et al., “Mortality in the United States, 2017.”
7 Kochhar, “The American Middle Class is Stable in Size, but Losing Ground Financially to Upper-Income Families.”
8 Measure of America and United Way. Common Good Forecaster.
9 Vasilogabros, “The Ethnic Groups That Still Believe in the American Dream.”
10 Jones et al., Beyond Economics: Fears of Cultural Displacement Pushed the White Working Class to Trump | PRRI/The Atlantic Report.
11 Burd-Sharps and Lewis, More than a Million Reasons for Hope: Youth Disconnection in America Today.
12 Inequality.org. “Facts: Wealth Inequality in the United States.”
13 Mack, “Social Exclusion.”
14 O’Neil, Weapons of Math Destruction: How Big Data Increases Inequality and Threatens Democracy.
15 Fourcade and Healy, “Seeing Like a Market.”
