Promising Gains, Persistent Gaps
To see the most recent data, check out our interactive tool on youth disconnection.
LAUNCHED MARCH 8, 2017
FULL REPORT | INTERACTIVE TOOL | MEDIA RELEASE
Read the congressional districts brief here.
Check out Measure of America and LeadersUp’s white paper on youth disconnection in Chicago.
Since Measure of America first wrote about youth disconnection half a decade ago, public awareness of both the plight and the promise of young people who are not in either school or the workforce has grown by leaps and bounds. Support for alternative school-to-work pathways like apprenticeships and career-technical education have seen a resurgence, the business-led 100,000 Opportunities Initiative met its goal to hire one hundred thousand disconnected youth well ahead of schedule, and at the time of writing, the Opening Doors for Youth Act of 2016 was introduced in Congress to make available significant federal investment to reconnect young people to school and employment.
Thanks to a greatly improved economy and efforts like those described above, the country has made real progress in tackling this important issue; this is good news we should all celebrate. But challenges remain: 4.9 million young women and men are still disconnected from the educational and employment opportunities required for rewarding, productive lives. If all disconnected youth lived together in a single state, that state would have roughly the population of South Carolina or Colorado. This report takes a look at who comprises this remaining group, what particular challenges they face, and what strategies have been shown to work.
Key findings include:

• Overall. In 2015, 4.9 million young adults between the ages of 16 and 24 were disconnected—12.3 percent of American youth, about one in eight. This is a significant drop from the post-recession high of 14.7 percent, over 5.8 million youth, in 2010.
• Rural-urban divide. This research shows that rural counties as a whole are faring considerably worse than more populous counties in terms of youth disconnection. In completely rural counties, the youth disconnection rate is 20.3 percent, much higher than the rate for counties in urban centers (14.2 percent) or for suburban counties (12.3 percent). Rural counties in the South have a particularly high rate: 24.0 percent—double the national rate.
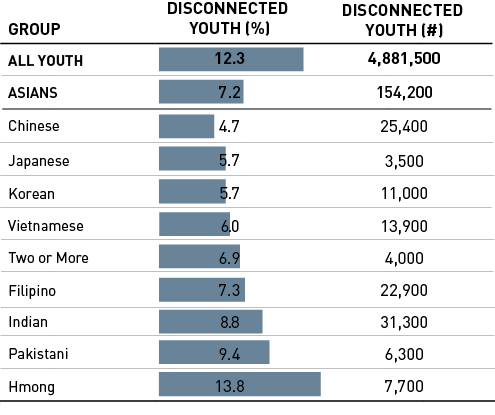
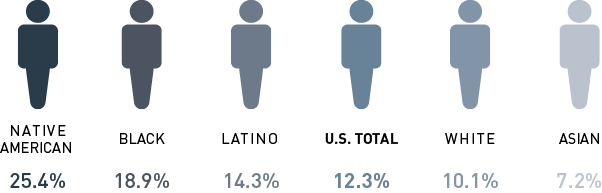
• Race and ethnicity. There is astonishing variation in disconnection rates by race and ethnicity, ranging from nearly one in fourteen Asian American youth to more than one in four Native American young people. The Asian American youth disconnection rate is 7.2 percent; the white rate is 10.1 percent; the Latino rate is 14.3 percent; the black rate is 18.9 percent; and the Native American rate is 25.4 percent. Though the rate varies among Asian subgroups, most are performing well on this indicator; only Hmong Americans have a rate of youth disconnection that surpasses the US average.
• Women and men. Nationally, girls and young women are slightly less likely to be disconnected than boys and young men, 12.0 percent vs. 12.5 percent, a small but statistically significant difference. The difference in youth disconnection rates between genders plays out differently for each race or ethnic group.
• States. Young people are disconnected at rates that range from under 8 percent in some states (New Hampshire, Nebraska, North Dakota, Vermont, Minnesota, and Iowa) to over twice that in others, with New Mexico (17.4 percent), West Virginia (17.0 percent), and Mississippi (16.7 percent) facing the greatest challenges.
• Black-white gaps. Measure of America calculated the disconnection rate for blacks, Latinos, and whites at the state level when data allowed. The black-white disparity is so stark that even in states where white youth are faring the worst, they are still doing better than US blacks on average, and even in states where blacks are faring the best, they are still not doing as well as US whites on average.
• Top and bottom metro areas. Among the country’s ninety-eight most populous metro areas, greater Albany, NY (6.5 percent), Grand Rapids, MI (6.8 percent), and Omaha, NE-IA (7.1 percent) had the lowest youth disconnection rates. The Bakersfield, CA (18.7 percent), McAllen, TX (19.7 percent), and Augusta, GA-SC (21.0 percent) metro areas had the highest rates.
• Congressional districts. Youth disconnection rates vary enormously by congressional district—from an impressively low rate of 4.4 percent in Wisconsin District 2, the mostly urban Madison area, to an alarmingly high rate of 23.1 percent—or nearly one in every four young people—in Kentucky District 5 in rural Appalachia. On average, a gap of 7.4 percentage points separates the best and worst districts within a state.
• Impact of poverty. For young people of all races, the probability of disconnection falls as household incomes rise. White youth in affluent households are less likely to be disconnected than white youth in poor households, and the same is true for the other racial and ethnic groups; however, blacks, Latinos, and Native Americans are more likely to be disconnected than whites and Asians given the same income level. In fact, the rate of youth disconnection for Asian Americans in households with almost no income is the same as that for black youth in households with incomes close to five times the federal poverty line. Native American youth living in households with incomes at five times the poverty line face roughly the same probablity of disconnection as white youth living in households with incomes well below the poverty line.
• Biggest improvements. Between 2010 and 2015, Washington, DC made the greatest progress, with a 43.9 percent reduction in the rate of youth disconnection. New Hampshire had the second-largest drop, nearly 32 percent, and now has the lowest rate of any state.
__________________________________________________________________________
For media and all other inquiries, contact us at: contact@measureofamerica.org | (718) 517-3720.