Making the Connection
Making the Connection: Transportation and Youth Disconnection
To see the most recent data, check out our interactive tool on youth disconnection.
LAUNCHED APRIL 25, 2019
FULL REPORT | INTERACTIVE TOOL | MEDIA RELEASE
Read the companion congressional district brief.
Since its peak in the aftermath of the Great Recession, the number of teens and young adults disconnected from both work and school in the United States fell for the seventh year in a row. The 2017 disconnection rate is 11.5 percent, a significant drop from the post-recession high of 14.7 percent in 2010. But a look into the latest data also shows some causes for concern. First, the decrease in the national disconnection rate between 2016 (11.7 percent) and 2017 (11.5 percent) was negligible. Second, for some groups, progress has halted or even reversed. The youth disconnection rate for black teens and young adults increased between 2016 and 2017. And despite years of decline in the country’s overall
disconnection rate, disparities between racial and ethnic groups persist. These findings indicate we cannot rely on economic growth alone to solve the problem of youth disconnection in America—societal factors such as poverty, discrimination, and residential segregation also play significant roles.
Making the Connection: Transportation and Youth Disconnection presents the latest available data on youth disconnection for the United States as a whole as well as disconnection rates by gender, race and ethnicity, region, state, and metro area. Determining who remains disconnected, and why, is vital to identifying interventions that will sustain or accelerate the positive trend we have observed over the past seven years. Because reducing youth disconnection will require an understanding of the structural factors driving it, the report also examines a key factor preventing young people from staying in school and the workforce: disparities in access to reliable and affordable transportation. Future reports will address additional structural barriers fueling disconnection.
KEY FINDINGS
- Nationally: The youth disconnection rate for the United States overall was 11.5 percent in 2017—down from 11.7 percent the previous year. This represents a total of about 4.5 million young people, or about one in nine.
- Disability: Disconnected young people are more than three times as likely to have a disability of some kind than connected young people—16.6 percent as compared to 5.0 percent. White male disconnected youth have the highest disability rate, 23.0 percent, but in general face fewer structural barriers to school persistence and employment than other groups.

- Gender: Boys and young men are slightly more likely to be disconnected than girls and young women, 11.9 percent as compared to 11.1 percent. But this ranking varies by race; among Asian, Latino, and Native American youth, young women have a slightly higher disconnection rate, whereas for black and white youth, young men do. The size of the gender gap is largest for black young people.
- Race and ethnicity: Of the country’s five major racial and ethnic groups, Asian American youth have the lowest disconnection rate, 6.6 percent, unchanged from their 2016 rate. White youth have the second-lowest rate (9.4 percent), followed by Latino (13.2 percent), black (17.9 percent), and Native American youth (23.9 percent). Latino youth saw the greatest improvement in their disconnection rate between 2016 to 2017, while black teens and young adults are the only group whose disconnection rate increased. Disconnection rates also vary by Asian and Latino subgroup.
- Regions: Disconnection continues to be a particular challenge in the South. The East South Central area, which includes Kentucky, Tennessee, Mississippi, and Alabama, has the highest disconnection rate overall, 14.2 percent. New England has the lowest rate, 8.26 percent.
- States: Minnesota has the lowest rate of youth disconnection (6.2 percent), followed by Iowa (7.0 percent) and Massachusetts (7.1 percent). West Virginia has the highest rate, 17.0 percent, followed by New Mexico (16.5 percent) and Mississippi (16.4 percent). Idaho experienced the largest increase in the share of disconnected young people between 2016 and 2017, nearly 25 percent. The state’s 2017 rate of 13.6 percent is almost as high as its 2014 peak of 14.0 percent. Alaska saw the largest drop in its disconnection rate, a decrease of 27 percent.
- Metro areas: Metro area youth disconnection rates range from a low of 5.6 percent in greater Grand Rapids, Michigan, to a high of 18.0 percent in the Memphis metro area. Metro area disconnection rates vary by gender as well as race and ethnicity. The metro area with the largest racial or ethnic gap is Louisville, KY-IN, where the black-white gap is 17.6 percentage points.
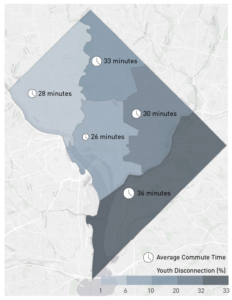
- Transportation: An examination of disconnection rates and commute times in two major cities, Washington, DC, and Chicago, reveals a link between transportation and youth disconnection. Average commute time and the youth disconnection rate are strongly correlated across DC neighborhoods. The correlation between the youth disconnection rate and the percentage of workers with very long commutes is also strong. In Chicago, the five areas with the highest youth disconnection rates, all above 20 percent, also have the highest rates of workers commuting an hour or more each way.
RECOMMENDATIONS
Through our research and engagement with stakeholders over the years, we have learned in greater detail about the challenges related to youth disconnection, as well as what works in addressing them. Though they overlap, these challenges and related recommendations can be organized into four very general buckets: confronting historical and intergenerational disadvantage, especially racism; supporting vulnerable youth; keeping youth connected; and reengaging disconnected youth. Read about challenges and recommendations here.
“Since its first report on the topic in 2012, Measure of America has provided rigorous and informative analysis of the experiences of this significant youth population.This report exemplifies the SSRC’s commitment to research that advances the public good and informs public debate.”
—Alondra Nelson, President of the Social Science Research Council
“At the Schultz Family Foundation, we believe every young person has the potential to succeed, and we’re committed to using research and data to inform both our efforts and the larger field of practice. Today’s report from Measure of America reinforces the importance in investing in this next generation of young people.”
—Daniel Pitasky, Executive Director of the Schultz Family Foundation
“Young people are the future of America. This could not be any clearer based upon the Measure of America work and report. Bias against any racial, ethnic or regional group that impedes the growth and development of this crucial segment of America’s population is not only cruel and unfair; it threatens the future social and economic prosperity and well-being of the nation. We must do all we can to make sure that all of America’s youth stay connected and committed to the future development and growth of America. It is not only the right thing to do, it is the smart course of action for our nation’s leaders.”
—James S. Jackson, Daniel Katz Distinguished University Professor of Psychology at the University of Michigan