Opportunity Index 2015
LAUNCHED OCTOBER 6, 2015 | MEDIA RELEASE
Five-Year View of U.S. Opportunity Shows Increasing Poverty and Income Inequality Hampering Larger Gains Post-Recession
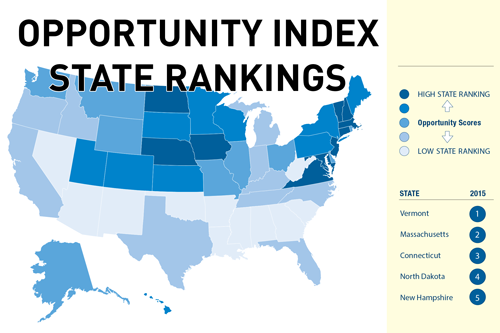
The Opportunity Index was developed jointly by Measure of America and Opportunity Nation and measures 16 indicators, scoring all 50 states plus Washington, D.C. on a scale of 0-100 each year. In addition, more than 2,600 counties are graded A-F, giving policymakers and leaders a useful tool to identify areas for improvement and to gauge progress over time.
The fifth annual U.S. Opportunity Index shows that access to opportunity has increased nearly 9 percent nationally since 2011, reflecting a dramatically improved post-recession employment picture, higher high school graduation rates and a significant drop in violent crime, among other factors. Despite these gains, increasing poverty and income inequality combined with stagnant wages continue to impede progress for middle and lower income communities.
Over the past five years, all 50 states and Washington DC and three-quarters of counties have improved on the Opportunity Index, an annual composite measure of 16 key economic, educational and civic indicators that expand or constrict access to economic mobility.
Yet, the 2015 Opportunity Index also reflects the nation’s uneven economic recovery. Millions of Americans are being left behind, including 5.5 million young adults, 13.8 percent of youth ages 16-24, who are disconnected from school and work. There are higher rates of poverty (+10.5%) and income inequality (+3.4%) and lower median family incomes (-4.2%) in 2015 than there were five years ago.