More Than a Million Reasons for Hope
More Than a Million Reasons for Hope: Youth Disconnection in America Today
To see the most recent data, check out our interactive tool on youth disconnection.
LAUNCHED MARCH 19, 2018
FULL REPORT | INTERACTIVE TOOL | MEDIA RELEASE
Click here to read brand new data on youth disconnection in congressional districts.
In 2016, the number of young people disconnected from both work and school declined for the sixth year in a row. The 2016 disconnected youth rate of 11.7 percent represents a 20 percent decrease since 2010, when disconnection peaked in the aftermath of the Great Recession—about 1.2 million fewer young people. A large group of young people saw their opportunities expand alongside the expanding economy; the youth unemployment rate was roughly half in 2016 what it was in 2010. But not all young people saw growth: 4.6 million young women and men remain disconnected from both school and the labor market, unmoored from routines of work and school that give shape, purpose, and direction to one’s days, and deprived of experiences that build knowledge, networks, skills, and confidence.
More than a Million Reasons for Hope: Youth Disconnection in America Today analyzes youth disconnection in the United States by state, metro area, county, and community type, and by gender, race, and ethnicity. Disconnected youth, also known as opportunity youth, are teenagers and young adults between the ages of 16 and 24 who are neither in school nor working. This report is the first in Measure of America’s disconnected youth series to compare American and European metro areas or to examine disconnection by group characteristics such as poverty status, motherhood, marriage status, disability, English proficiency, citizenship, educational attainment, institutionalization, and household composition for different racial and ethnic groups.
Key Findings
• OVERALL. In 2016, 11.7 percent of young Americans were disconnected, an improvement from the 2015 rate of 12.3, and a 20 percent decrease from the 2010 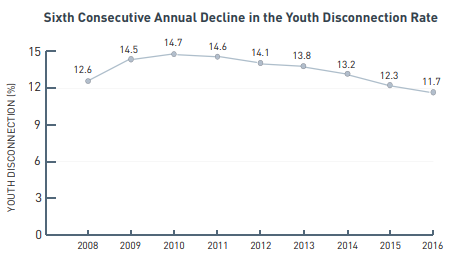 peak rate of 14.7 percent. Yet 4.6 million young people remain out of work and out of school.
• STATES AND REGIONS. Youth disconnection ranges from 7 percent in North Dakota to 17.9 percent in Alaska. Young people in the Midwest are the least likely to be disconnected, with a rate of 10.2 percent, while young people in the South are the most likely, with a rate of 12.9 percent.
• METRO AREAS. Among the nearly one hundred most populous metro areas, disconnection rates range from 6.1 percent in the Des Moines metro area to 20.7 percent in greater Bakersfield, California. Six European metro areas have rates lower than Des Moines, and Istanbul, the metro area with the highest rate of disconnection in Europe, has a rate just under that of Bakersfield, CA.
• URBAN-RURAL DIVIDE. Young people living in rural areas have the highest rate of youth disconnection, 19.3 percent, followed by those living in towns (14.9 percent) and urban centers (12.9 percent). Suburban youth are the least likely to be disconnected, with a rate of 11.3 percent. Disconnection rates in rural counties vary immensely, from essentially 0 percent to 76.6 percent.
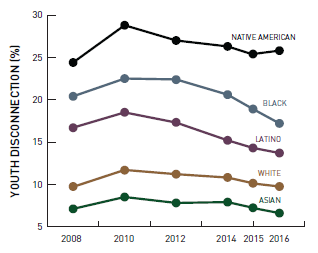
• RACE AND ETHNICITY. There is a chasm of nearly 20 percentage points in disconnection rates separating racial and ethnic groups. Asian youth have the lowest rate of disconnection (6.6 percent), followed by white (9.2 percent), Latino (13.7 percent), black (17.2 percent), and lastly, Native American (25.8 percent) youth. Youth disconnection has decreased over time for all major racial and ethnic groups; however, the gap between the groups with the highest and lowest rates has not narrowed appreciably.
• GENDER. Overall, young women are less likely to be disconnected, with a rate of 11.2 percent compared to the male rate of 12.1 percent. However, the rate of female disconnection varies widely by race and ethnicity, from 6.6 percent among Asian young women and 9.4 percent among white women, to 14.2 and 14.8 percent among black and Latina women respectively, and 23.4 percent among Native American women. Disconnected young women face particularly high poverty rates and unique challenges like early marriage and motherhood that merit attention and resources.
• SUBGROUPS. Racial and ethnic categories can mask diversity within groups. Among Asians, Vietnamese youth have the lowest rate of disconnection, 4.5 percent, and Hmong youth have the highest, 15.1 percent. Among Latinos, rates range from 8.9 percent for South Americans to 14.9 percent for young people who trace their roots to the Spanish-speaking Caribbean.
• LIVING ARRANGEMENTS. Disconnected young people are about two-and-a-half times as likely to be living with family other than their parents, about twice as likely to be living with a roommate, and eight times as likely to be living alone than their connected peers. Young people who do not have a stable living situation often lack the emotional and financial support of parents or other consistent, caring adults—an additional barrier in the transition to adulthood.
• INSTITUTIONALIZATION. An alarmingly high proportion of disconnected black boys and young men—nearly a fifth—is institutionalized, compared to just 0.3 percent of the overall population ages 16 to 24.
• LANGUAGE PROFICIENCY AND CITIZENSHIP. About 40 percent of disconnected Asian youth—and nearly half of disconnected Asian girls—are noncitizens. A third of disconnected Asian girls and about a fifth of disconnected Latinas are not English proficient.
• IMPROVEMENTS AND SETBACKS. Thirty-eight states experienced a significant improvement since 2010. Over the past year alone, twelve states saw a significant improvement in their disconnection rates, but Washington, DC, and Nebraska had setbacks.
For media and all other inquiries, contact Dewey Blanton: blanton@ssrc.org | (718) 517-3721.