Our Work
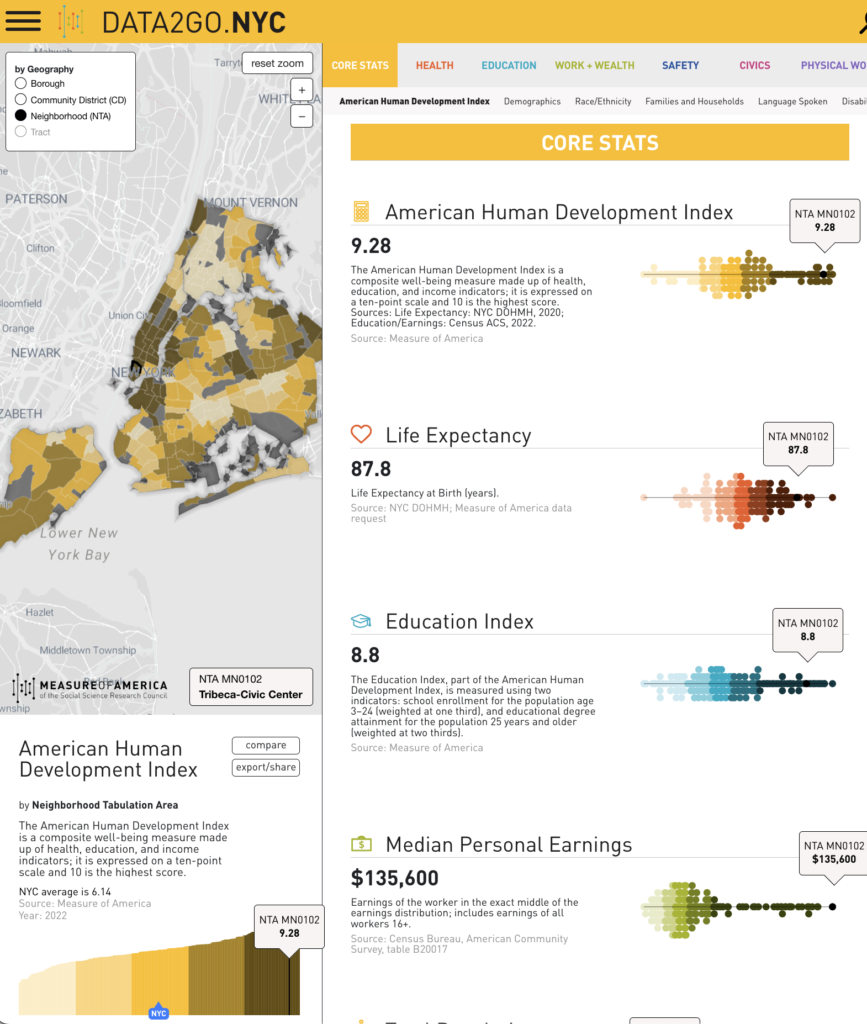
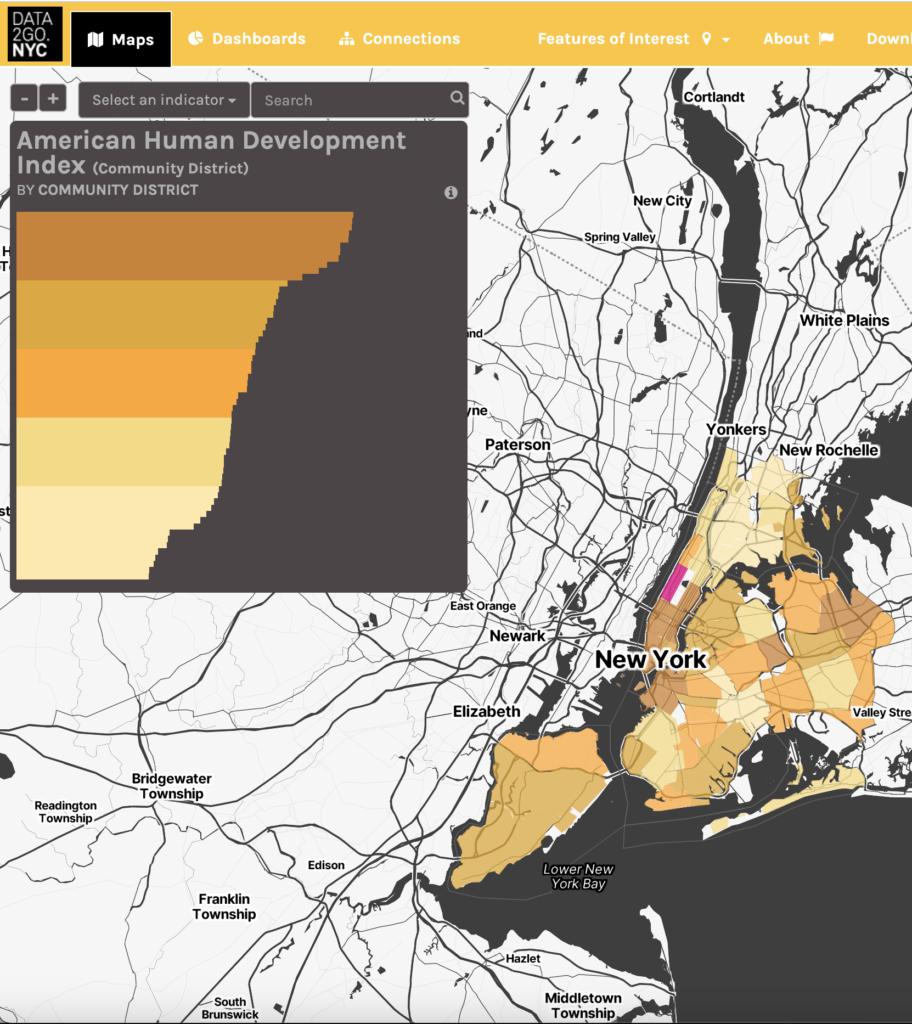
DATA2GO.NYC
Data Tool | April 30, 2025DATA2GO.NYC is a free, interactive tool that lets you explore over 400 indicators related to human well-being and inequality across New York City's nearly 200 neighborhoods.
Youth Disconnection Interactive Tool
Data Tool | October 31, 2024Millions of young people in the United States are neither working nor in school. Explore the latest youth disconnection data for yourself in this interactive tool.
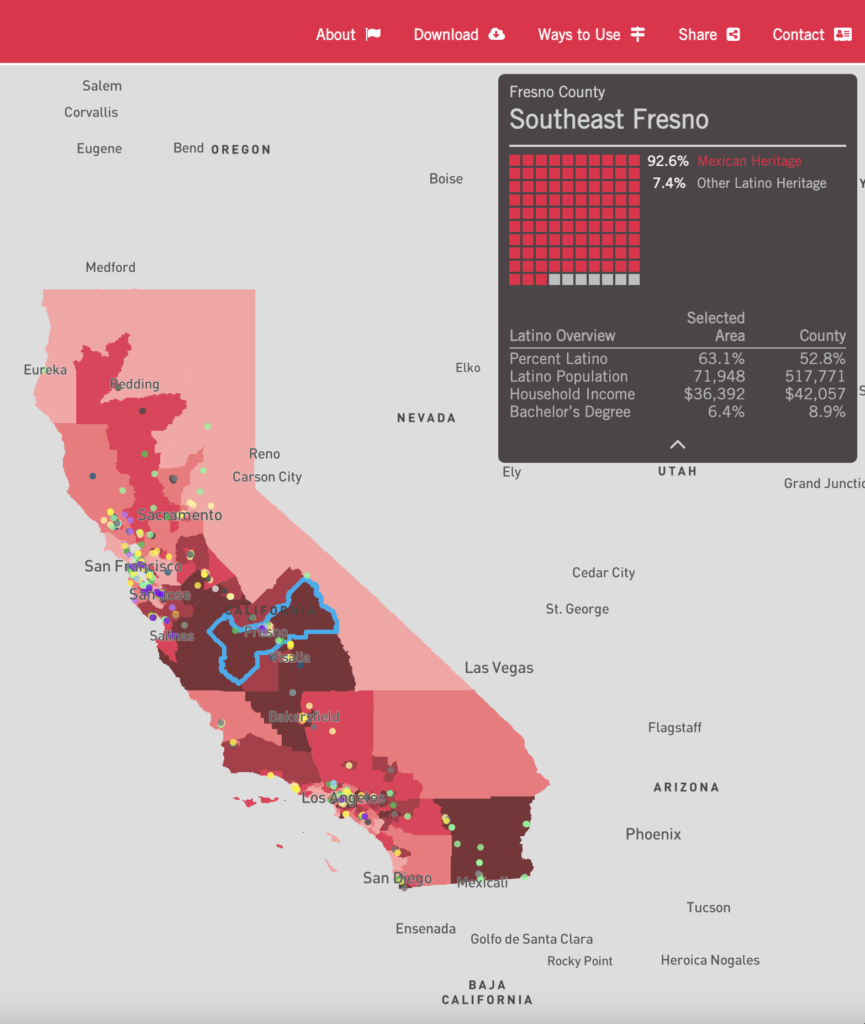
California Latino Power Map
Data Tool | December, 2019The California Latino Power Map showcases the most comprehensive list of Latino-led nonprofits in California and presents the challenges and opportunities communities face through a wide range of socioeconomic indicators.
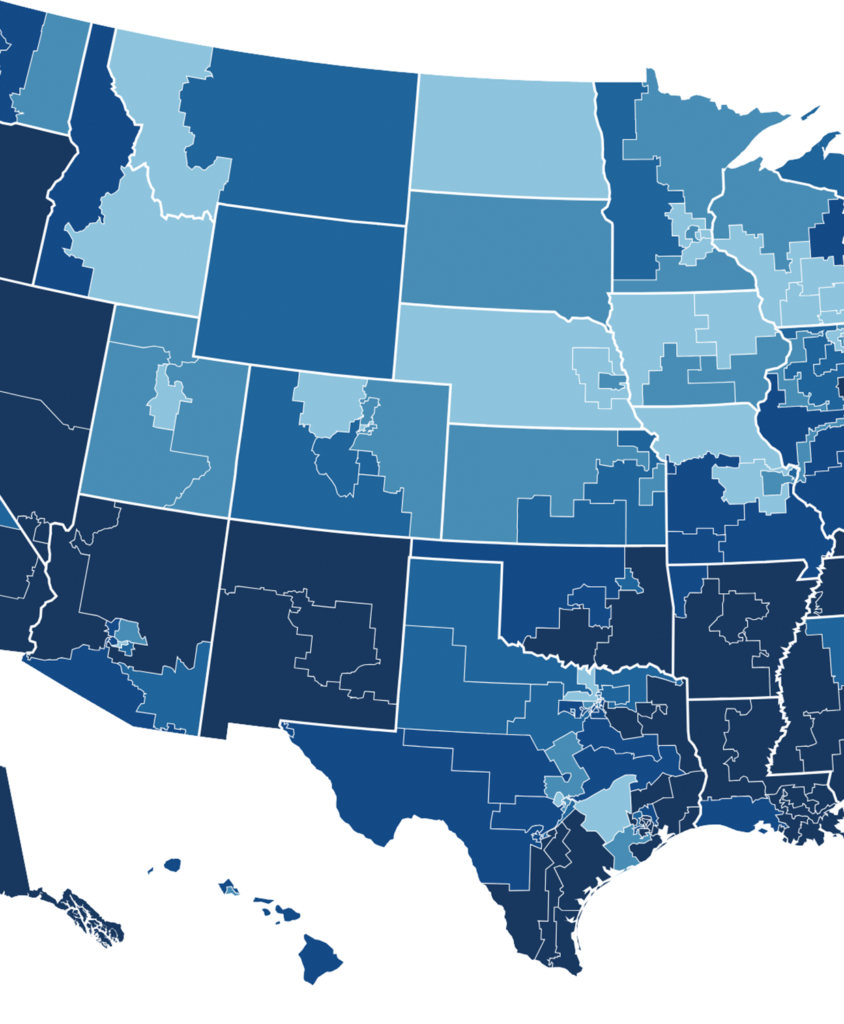
Mapping America Tool
Data Tool | June 17, 2021With over 100 indicators, Mapping America allows users to explore data like they never have before. Users can plug in their zip codes to locate human development levels within their own communities, compare places and indicators, and more.
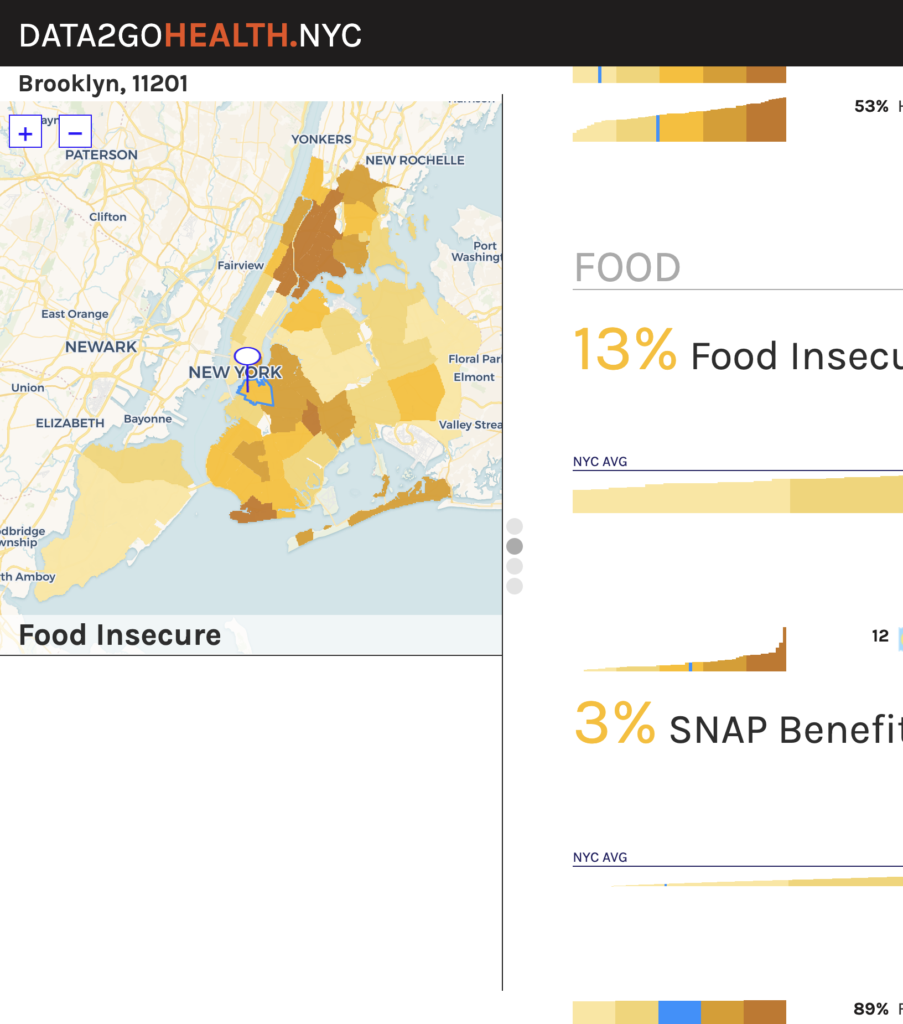
DATA2GOHEALTH.NYC
Data Tool | November 15, 2018DATA2GOHEALTH.NYC builds on DATA2GO.NYC, its sister tool, and provides reliable, up-to-date information on neighborhood assets and challenges across a broader range of health sectors.
OurHome.NYC
Data Tool | February 12, 2020OurHome.NYC is a free, easy-to-use online mapping and data tool that depicts the relationship between health, as measured by life expectancy, and housing across more than 300 New York City Housing Authority (NYCHA) developments.
NYC Community Portraits
Short Read | June 21, 2018This site features the community portraits created by nearly 20 NYC-based human services organizations to illuminate important well-being challenges and unmet human needs in their neighborhoods or fields using the indicators found in DATA2GO.NYC.
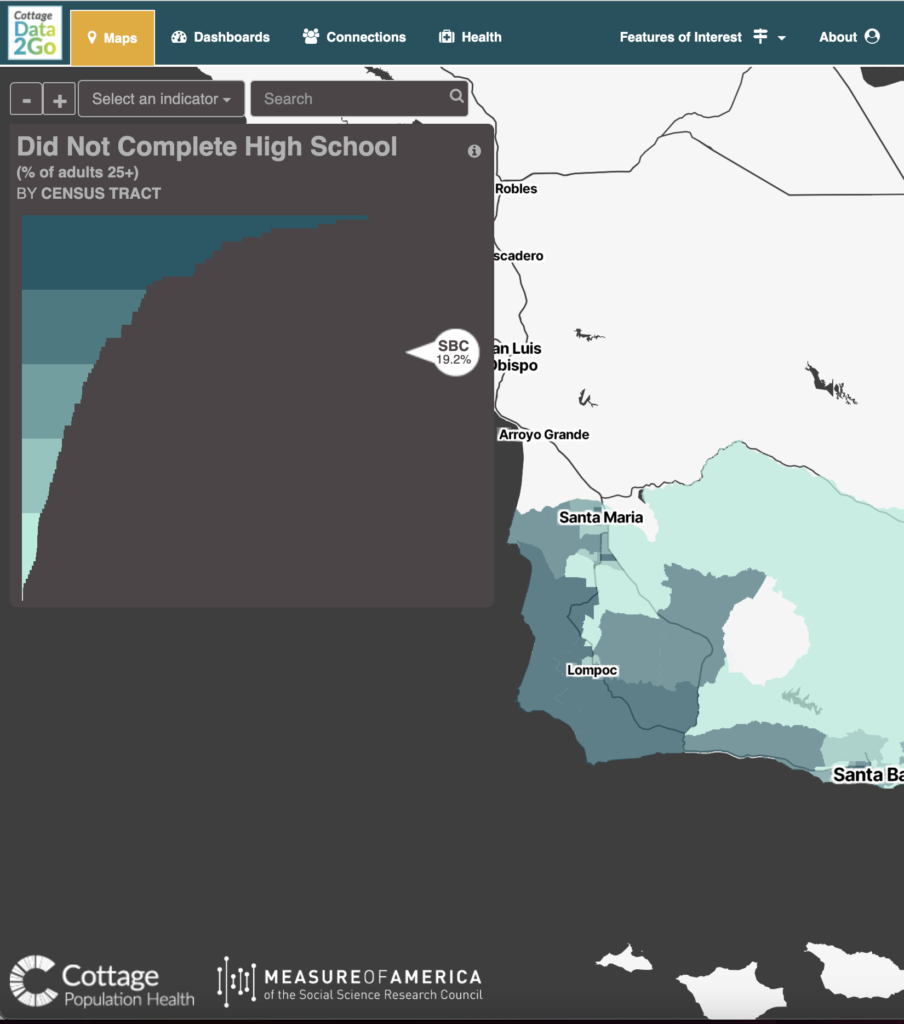
Cottage Data2Go
Data Tool | July 21, 2017Cottage Data2Go is a free, interactive online mapping and data tool that brings together data on a broad range of social and health factors that reflect the well-being of Santa Barbara County residents.
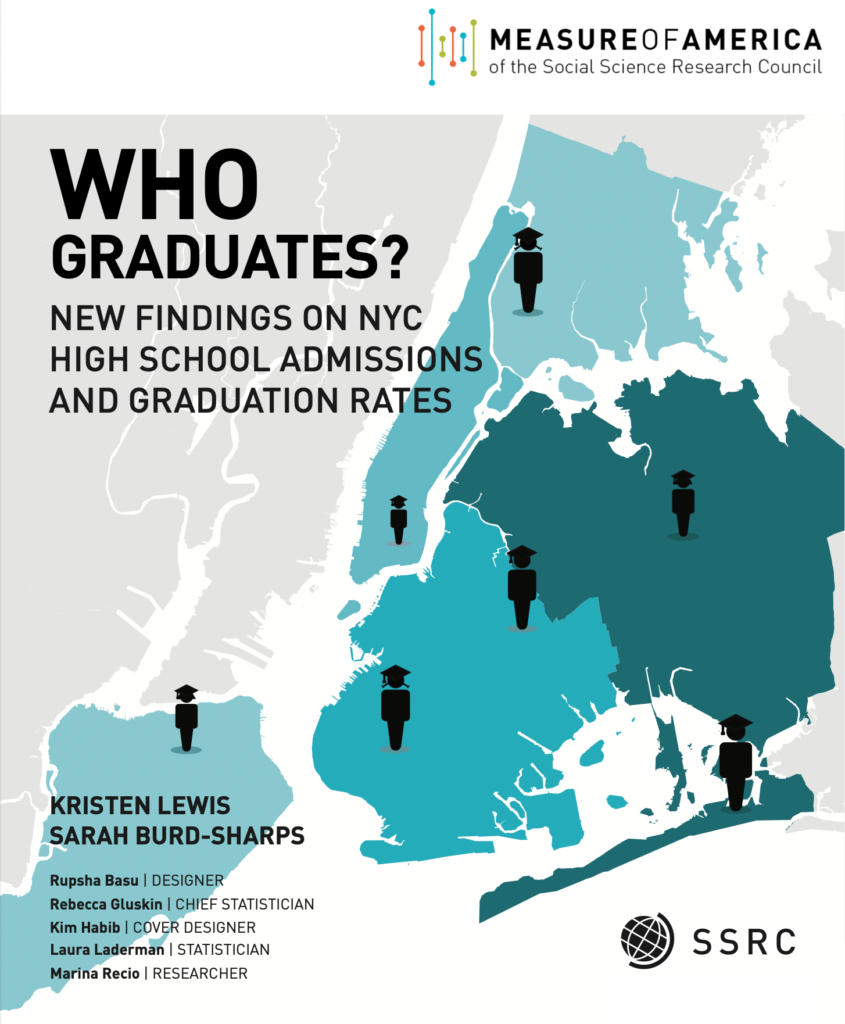
Who Graduates?
Data Tool | May 5, 2017Beginning in 2016, Measure of America worked with the New York Times for nearly a year to develop a custom dataset that analyzes NYC high school graduation rates in a way that hasn’t been done before.
Measure of America at the Smithsonian
Short Read | September 30, 2017Measure of America work was featured in the Cooper Hewitt, Smithsonian Design Museum's third exhibition in a series about socially responsible design, "By the People: Designing a Better America."
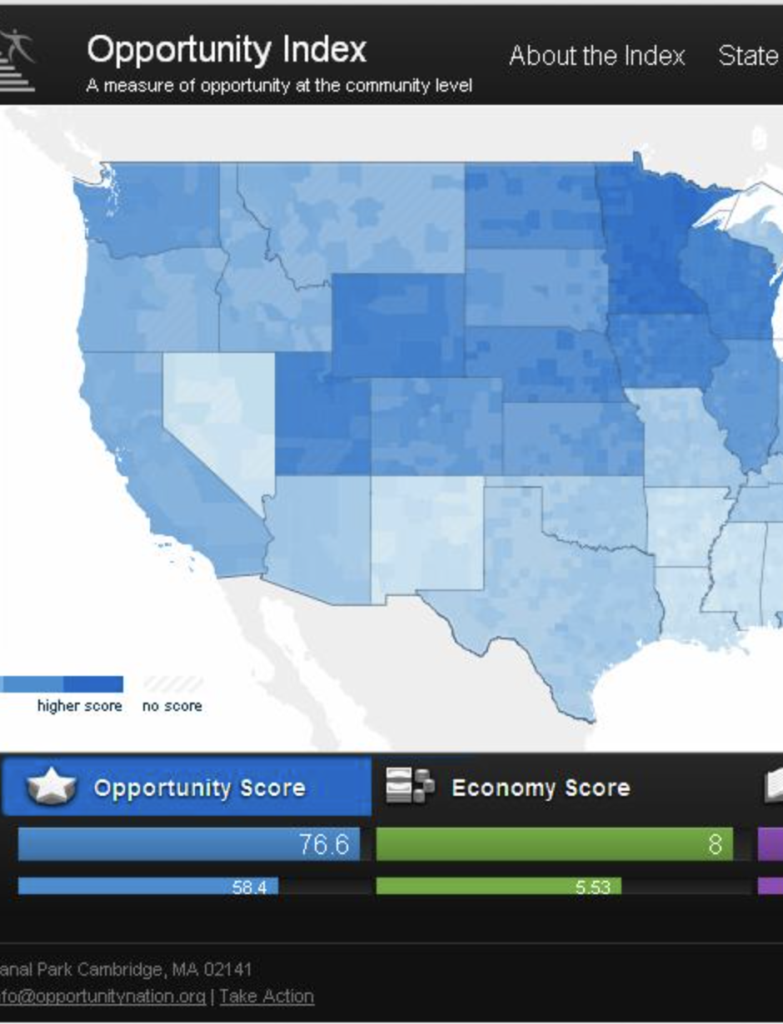
Opportunity Index 2015
Data Tool | October 6, 2015Focusing on three main dimensions, the Opportunity Index provides rankings of states and counties, and is the centerpiece of a nationwide campaign to refocus priorities on access to opportunity for all Americans.
Opportunity Index 2014
Data Tool | October 15, 2014Focusing on three main dimensions, the Opportunity Index provides rankings of states and counties, and is the centerpiece of a nationwide campaign to refocus priorities on access to opportunity for all Americans.
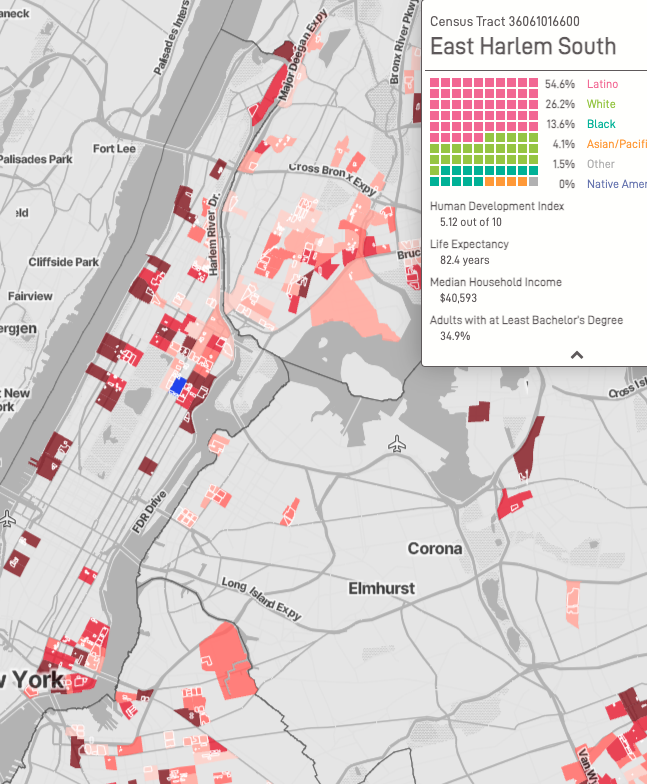
DATA2GO.NYC
Data Tool | October 28, 2015Data2Go.NYC allows users to visualize where people in need are, what resources are available to assist them, where gaps exist, and how different factors interact to shape the choices and opportunities available to them.
2013 Opportunity Index
Data Tool | January 28, 2014Focusing on three main dimensions, the Opportunity Index provides rankings of states and counties, and is the centerpiece of a nationwide campaign to refocus priorities on access to opportunity for all Americans.
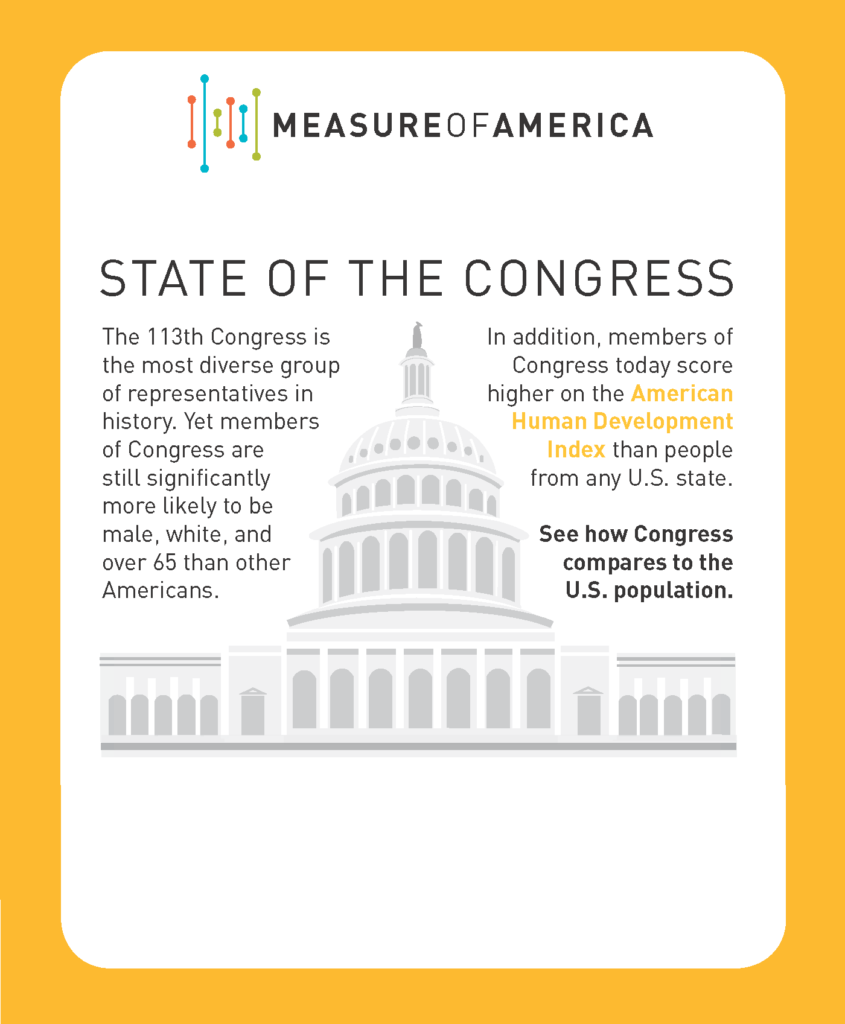
State of the Congress 2013
Short Read | January 28, 2013The 113th Congress is the most diverse group of representatives in history. Yet its members are still significantly more likely to be male, white, and over 65 than other Americans. And in terms of basic well-being and access to opportunity, members of Congress are far ahead of the average in earnings and education but lag in life expectancy.
2012 Opportunity Index
Data Tool | September 12, 2012Focusing on three main dimensions, the Opportunity Index provides rankings of states and counties, and is the centerpiece of a nationwide campaign to refocus priorities on access to opportunity for all Americans.
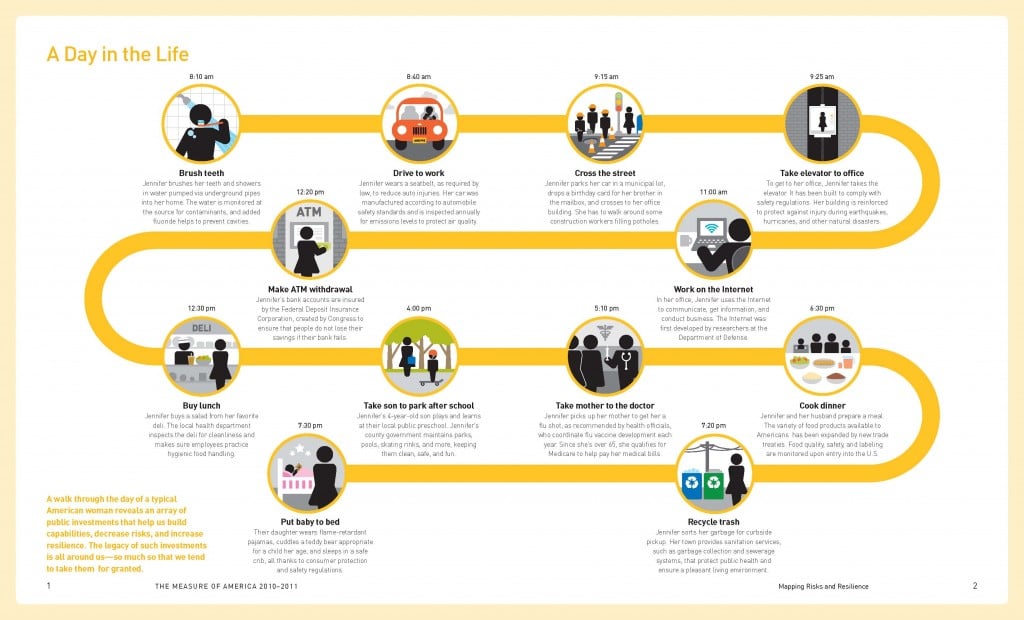
A Day in the Life
Short Read | May 11, 2012A day in the life of a typical American woman reveals an array of public investments that help us build capabilities, decrease risks, and increase resilience.
2011 Opportunity Index
Data Tool | November 3, 2011Focusing on three main dimensions, the Opportunity Index provides rankings of states and counties, and is the centerpiece of a nationwide campaign to refocus priorities on access to opportunity for all Americans.
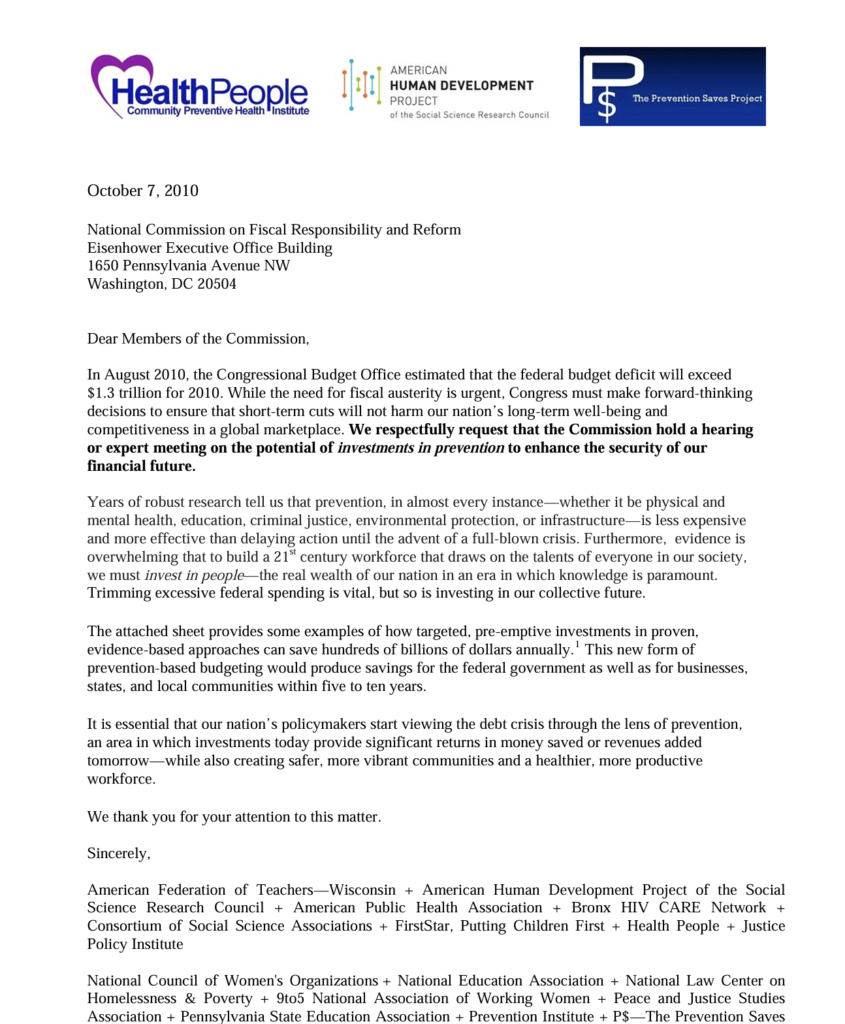
Open Letter to the Bipartisan Fiscal Commission, October 7, 2010
Short Read | October 7, 2010Letter urges commission to hold a hearing on investments in prevention today that will provide significant returns in money saved or revenues added tomorrow.
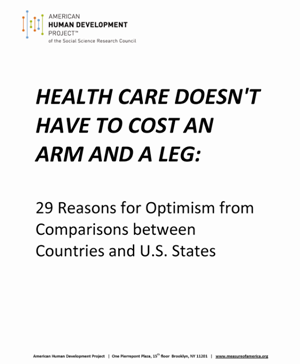
29 Reasons for Optimism on Health Care Spending
Short Read | March 10, 2010A report by American Human Development Project ranks the 50 states and Washington, D.C. against 80 countries in the world on life expectancy at birth, infant death rates, and annual per person spending on health care.
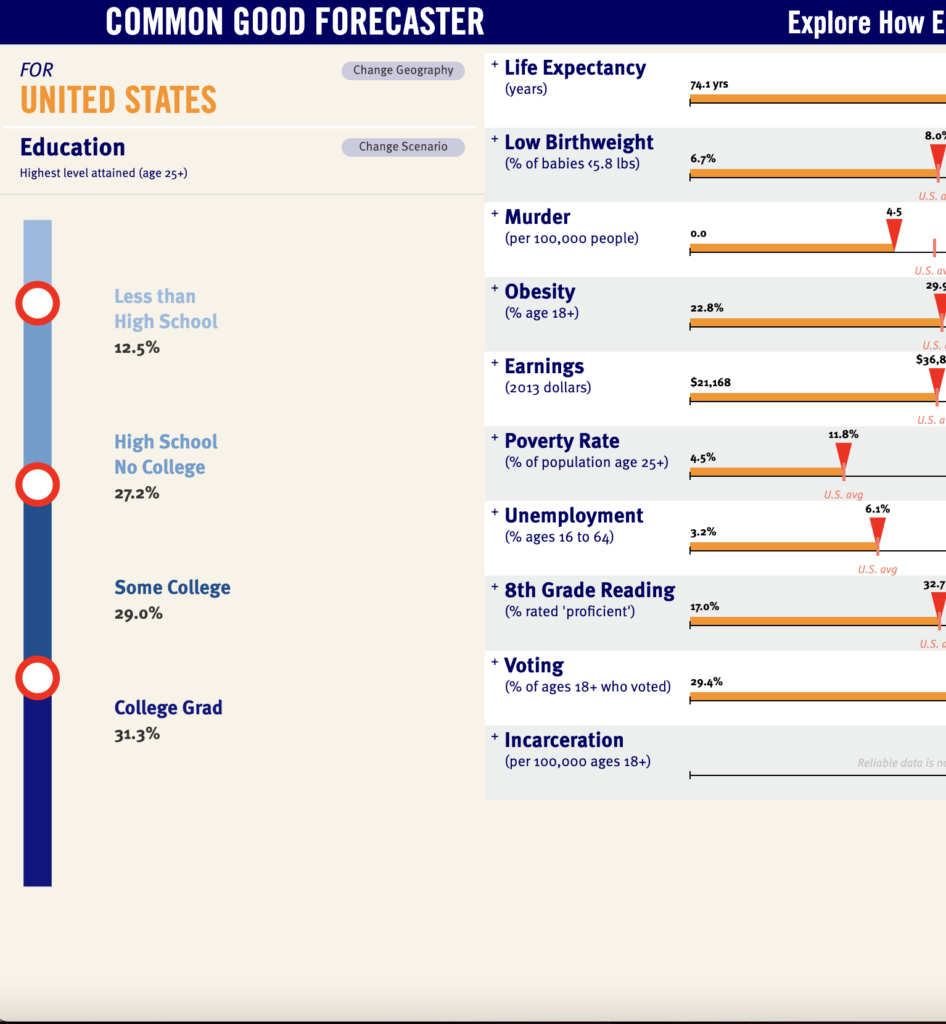
Common Good Forecaster
Data Tool | 2017The Common Good Forecaster is a tool that shows how vital economic and social issues in your community might change if educational outcomes were better.
The Well-O-Meter™
Data Tool | 2008You have seen where your state and congressional district stack up in the American HD Index rankings, but what about you? Get a general sense of your own human development level by using The Well-O-Meter™.