Our Work
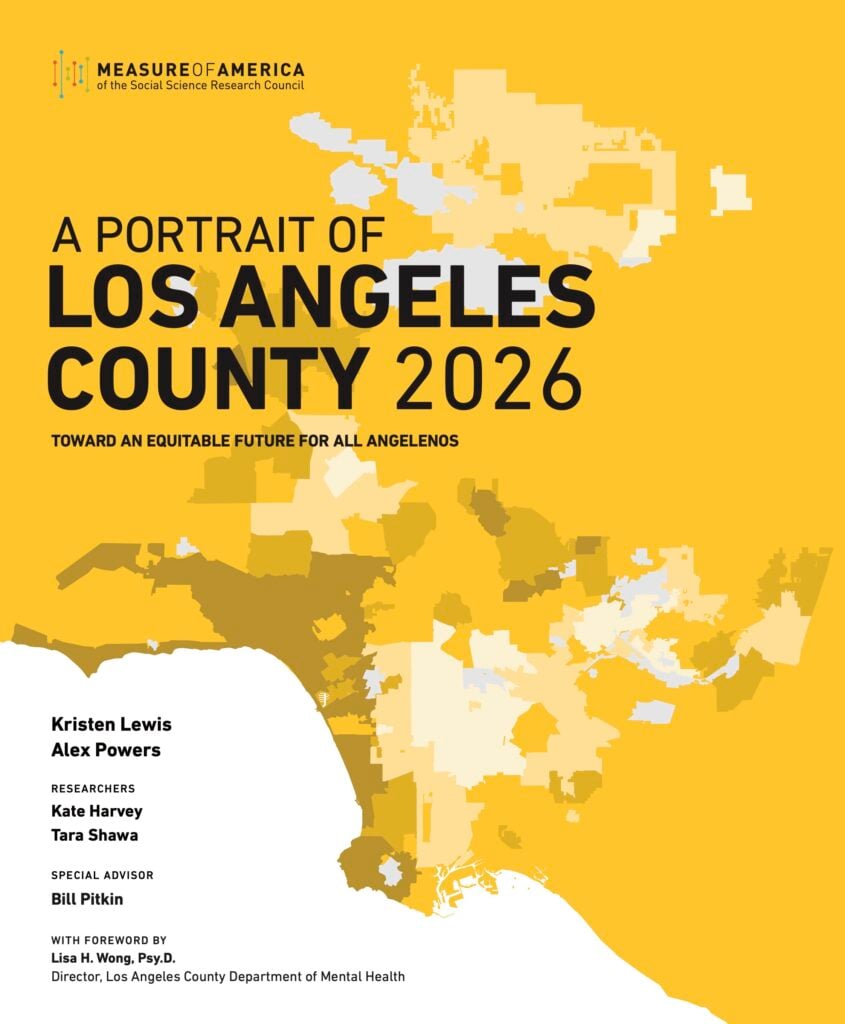
A Portrait of Los Angeles County 2026
Report | March 11, 2026A Portrait of Los Angeles County 2026 takes an in-depth look into well-being and opportunity in Los Angeles County, one of the most diverse places in the nation.
Youth Disconnection in America 2025
| Coming Soon
Broad Recovery, Persistent Inequity: Youth Disconnection in America
Report | October 31, 2024Broad Recovery, Persistent Inequity presents 2022 youth disconnection rates for the United States as a whole as well as by gender, race and ethnicity, region, state, metro area, and congressional district.
Ensuring an Equitable Recovery: Addressing Covid-19’s Impact on Education
Report | October 3, 2023Ensuring an Equitable Recovery presents 2021 youth disconnection rates for the United States as a whole as well as by gender, race and ethnicity, region, state, metro area, and congressional district.
Building Bright Futures for Youth in Los Angeles
Report | November 17, 2022Building Bright Futures for Youth in Los Angeles: Spotlight on Young Women provides an in-depth look at youth disconnection in Los Angeles County. The report also has a special focus on young women.
Mapping America Tool
Data Tool | June 17, 2021With over 100 indicators, Mapping America allows users to explore data like they never have before. Users can plug in their zip codes to locate human development levels within their own communities, compare places and indicators, and more.
Making the Connection
Report | April 25, 2019This report presents the latest available data on youth disconnection for the United States as a whole as well as by gender, race and ethnicity, region, state, and metro area. It also examines a key factor preventing young people from staying in school and the workforce: disparities in access to reliable and affordable transportation.
Measuring America: 10 Years and Counting
Report | December 14, 2018“Measuring America: 10 Years and Counting” explores trends in American Human Development Index scores over the past decade by race and ethnicity, gender, and U.S. state, revealing the uneven nature of America’s rebound from the 2007 financial crisis.
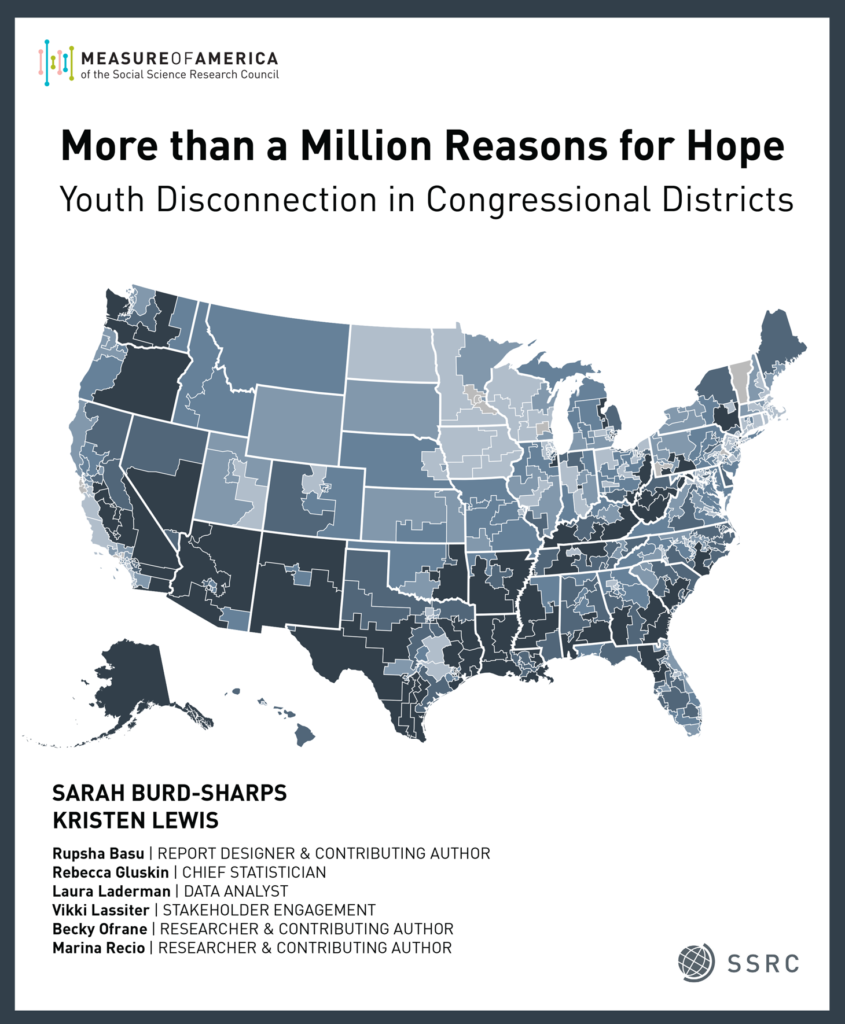
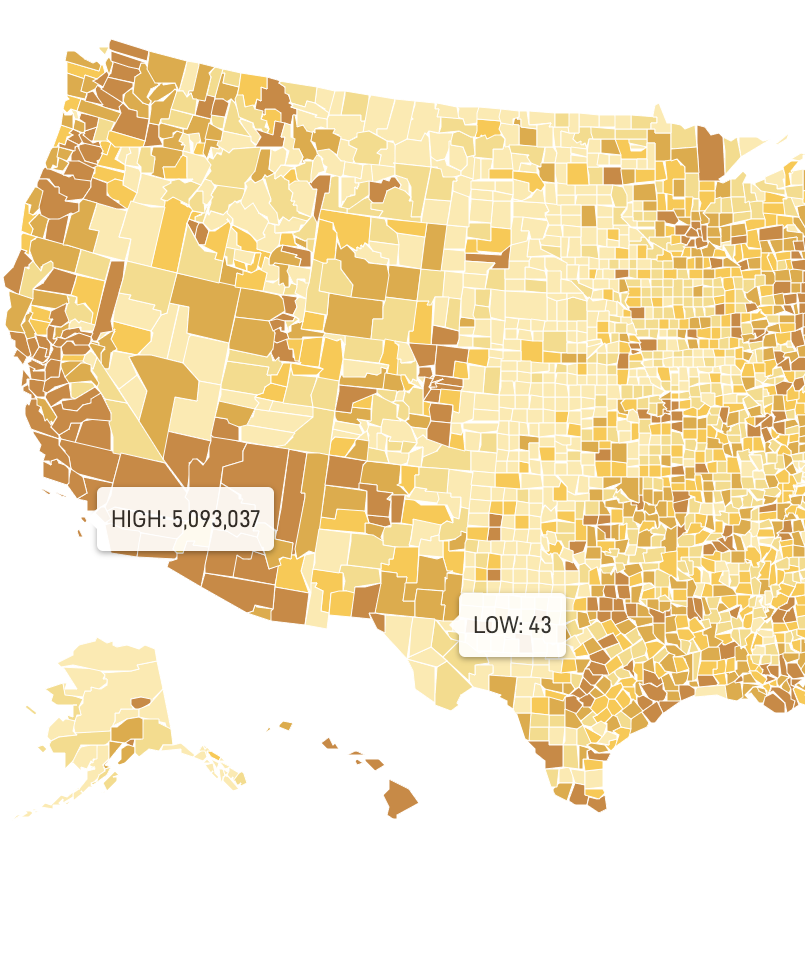
More Than a Million Reasons for Hope
Report | March 19, 2018This report analyzes youth disconnection in the United States by state, metro area, county, and community type, and by gender, race, and ethnicity. It is the first in Measure of America’s disconnected youth series to compare American and European metro areas or to examine disconnection by group characteristics.

A Portrait of Los Angeles County
Report | November 29, 2017A Portrait of Los Angeles County is an exploration of how LA County residents are faring in terms of well-being and equity.
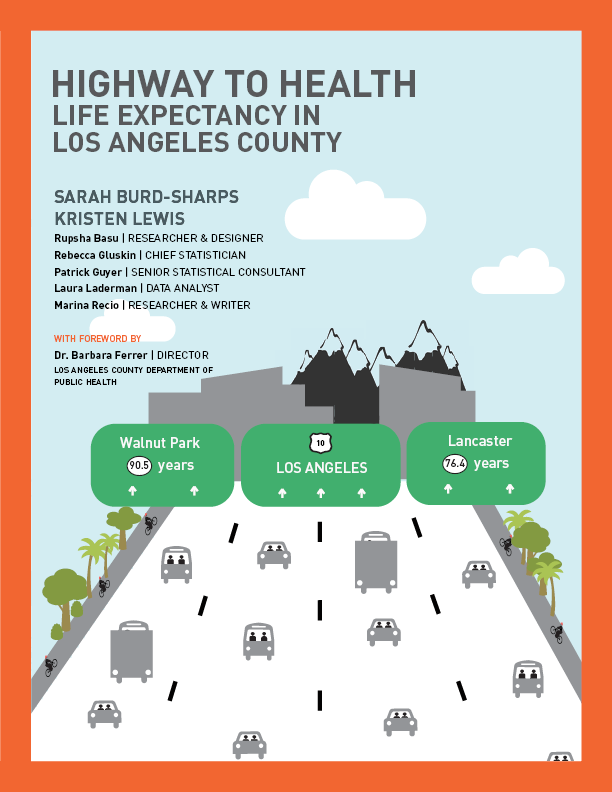
Highway to Health
Report | October 4, 2017Highway to Health: Life Expectancy in Los Angeles County reveals up-to-date life expectancy calculations for cities and unincorporated areas within Los Angeles County, the first release of such data in more than a decade.
Measure of America at the Smithsonian
Short Read | September 30, 2017Measure of America work was featured in the Cooper Hewitt, Smithsonian Design Museum's third exhibition in a series about socially responsible design, "By the People: Designing a Better America."
Geographies of Opportunity
Report | April 22, 2015Geographies of Opportunity: Ranking Well-Being by Congressional District is an in-depth look at how residents of America's 436 congressional districts are faring in three fundamental areas of life: health, access to knowledge, and living standards.
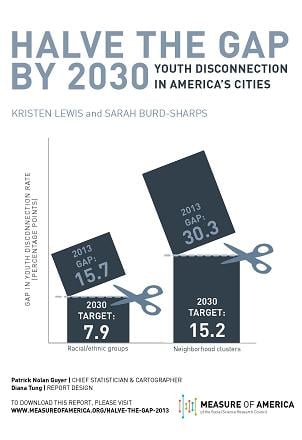
HALVE THE GAP BY 2030: Youth Disconnection in America’s Cities
Report | October 24, 2013In this report we imagine, in very specific terms, a different, better tomorrow. We lay out an ambitious but attainable goal: to halve the gaps between the most- and least-connected neighborhoods and between racial groups in half by 2030.
The Measure of America 2013–2014
Report | June 19, 2013This third volume in the Measure of America series measures well-being in three vital areas—health, education, and earnings—that shape the opportunities available to us and enable people to invest in their families and live to their full potential.
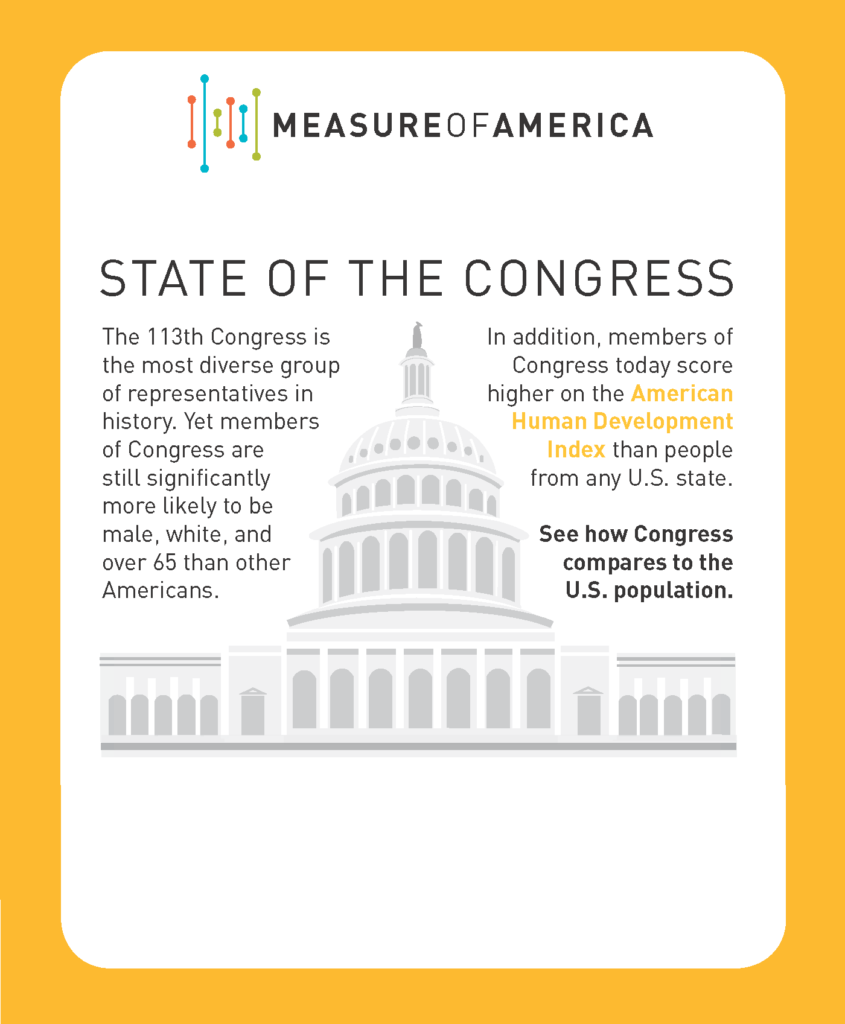
State of the Congress 2013
Short Read | January 28, 2013The 113th Congress is the most diverse group of representatives in history. Yet its members are still significantly more likely to be male, white, and over 65 than other Americans. And in terms of basic well-being and access to opportunity, members of Congress are far ahead of the average in earnings and education but lag in life expectancy.
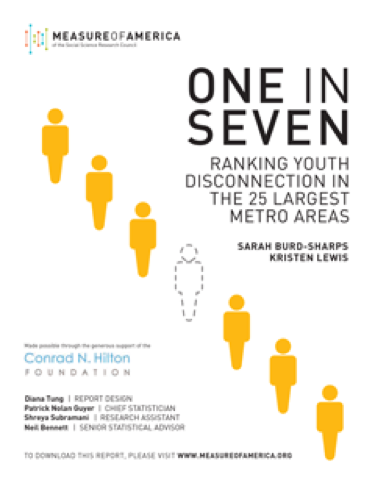
One in Seven
Report | September 13, 2012An astonishing one in every seven Americans ages 16 to 24 is neither working nor in school—5.8 million young people in all. This brief ranks the country’s 25 largest metropolitan areas as well as the nation’s largest racial and ethnic groups in terms of youth disconnection.
The Measure of America 2010-2011: Mapping Risks and Resilience
Report | November 10, 2010The book contains American Human Development Index ranking for all 50 states, 435 congressional districts, major metropolitan areas, racial and ethnic groups, as well as men and women.

A Century Apart: New Measures of Well-being for U.S. Racial and Ethnic Groups
Report | April 27, 2010An entire century of human progress separates the worst-off from the best-off groups within the U.S., according to the latest update of the American Human Development (HD) Index.

The Well-O-Meter™
Data Tool | 2008You have seen where your state and congressional district stack up in the American HD Index rankings, but what about you? Get a general sense of your own human development level by using The Well-O-Meter™.
The Measure of America 2008–2009
Report | July 2008The Measure of America is the first-ever human development report for a wealthy, developed nation. It introduces the American Human Development Index, which provides a single measure of well-being for all Americans, disaggregated by state and congressional district, as well as by gender, race, and ethnicity.