2013 Opportunity Index
The Opportunity Index was unveiled in September 2011, ranking every state and over 2,400 counties. The updated 2013 Opportunity Index, which was launched in November 2013, reflects the status of opportunity in America now and offers comparisons with the last two years.
Some new findings of the 2013 Opportunity Index were:
- 26 states and Washington, D.C. improved their Opportunity Scores
- Unemployment rates declined, but 49 states saw an increase of those living below the poverty line
- 46 states experienced a drop in median household income in 2013, and income inequality increased in 39 states over three years
- Internet access improved in all 50 states and Washington, D.C. – yet 19 million Americans still lack internet access
- 44 states saw a decrease in violent crime
About the Opportunity Index:
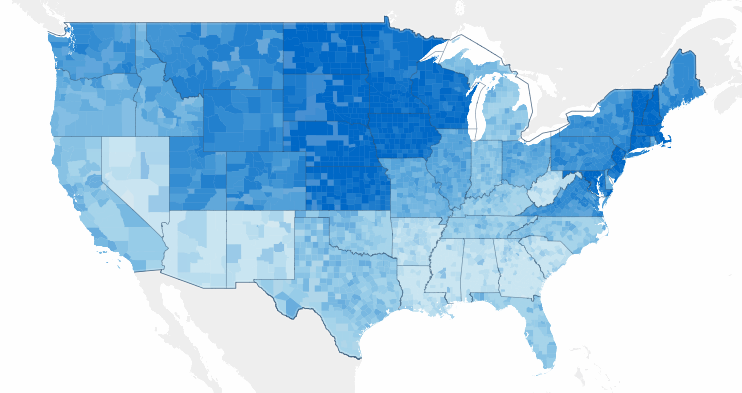
Geography should not determine destiny, but the sad reality is that for many Americans where you live has tangible effects on your ability to climb the ladder of opportunity. Restoring this key part of the American dream requires action, and action requires knowing where we stand. Analysis of the quilt of economic opportunity and upward mobility in America can reveal where the American dream thrives – and where it struggles.
In order to measure community opportunity, Measure of America and Opportunity Nation jointly developed the Opportunity Index, an interactive online tool. Focusing on three key dimensions, the Opportunity Index is a unique tool designed to provide a snapshot of what opportunity looks like in our communities.
The Index is designed to connect economic, educational, civic and community factors together to help identify obstacles to opportunity and mobility – and develop concrete solutions. This tool is needed since GDP and unemployment rates do not give the whole picture of opportunity; the Index reveals the interconnected conditions in American communities that impact upward mobility and access to opportunity.
__________________________________________________________________________
For media and all other inquiries, contact Eric J. Henderson: eric@measureofamerica.org | (718) 517-3606.
For more tailored products and services, please visit our Services page.
The Measure of America 2013–2014
LAUNCHED JUNE 19, 2013
FULL REPORT | INTERACTIVE MAP | MEDIA RELEASE
 In the era of “big data,” it would seem that policymakers and regular people alike would have the information they need at their fingertips to understand their world and make it better. Unfortunately, that’s far from the case. Though we know the country’s gross domestic product quarterly, its retail sales monthly, and stock market numbers minute-by-minute, we rarely hear statistics on our country’s people.
How long can a baby born today in Missouri, New Mexico, or Minnesota expect to live? What proportion of adults have completed high school in Houston as compared to Dallas? What wages and salaries are typical of Latinos in the United States, and how do they compare to those of whites or African Americans?
Measure of America’s mission is to use data points like these to tell the story of how people—not just the economy—are doing. We do so using the global gold standard for measuring well-being and access to opportunity: the Human Development Index.
This third volume in the Measure of America series measures well-being in three vital areas—health, education, and earnings—that shape the opportunities available to us and enable people to invest in their families and live to their full potential. The Measure of America 2013–2014 contains American Human Development Index ranking for the 50 U.S. states, the 25 largest metropolitan areas, and racial and ethnic groups within those states and metro areas. It also looks at changes in well-being in states since 2000 and in metro areas before and after the Great Recession.
Among the key findings of The Measure of America 2013-2014:
CHANGE OVER TIME
- Michigan, the only state with a 2010 American HD Index score lower than its 2000 score, saw the greatest decline in human development over the past decade.
- While the Great Recession undoubtedly pulled wages downward, the trend in declining earnings started before the financial collapse. From 2000 to 2005, wages stalled or declined in thirty-nine states after four decades of slow but steady national progress in earnings.
- Resources like natural gas enabled states such as New Mexico, Montana, and West Virginia to avoid the earnings losses most other states faced between 2000 and 2010. But their HD Index rankings remained low; valuable natural resources do not automatically fuel improvements in people’s well-being.
- Of the five major U.S. racial and ethnic groups, African Americans saw the greatest increase in life expectancy, nearly three years. However, African Americans started from the lowest point and still have the shortest life spans. Native Americans were the only racial or ethnic group whose life expectancy did not increase between 2000 and 2010.
- The five metro areas whose Index scores increased the most from 2008 to 2010, Baltimore, Washington, D.C., San Antonio, Dallas, and Boston, did so largely on the strength of improvements in health. San Antonio, although it ranked last in 2008 and second-to-last in 2010, is gaining ground comparatively quickly.
- The only five metro areas whose American Human Development Index scores declined from 2008 to 2010 were Detroit, Portland, Atlanta, Miami, and Tampa-the same cities that lost the most ground in terms of earnings over that period.
RACE AND ETHNICITY
- The top-scoring racial/ethnic group on the American HD Index is Asian Americans (7.21), followed by whites (5.43), Latinos (4.05), African Americans (3.81), and Native Americans (3.55).
- Asian Americans score highest in each of the three components of the Index: at the national level, they live the longest, have the most education, and earn the most.
- Latinos have the second-longest life span, outliving whites, on average, by nearly four years.
- African Americans have the shortest lives, but their educational outcomes and earnings exceed those of both Latinos and Native Americans.
U.S. STATES
- The top five states on the American HD Index are Connecticut, Massachusetts, New Jersey, the District of Columbia, and Maryland.
- The bottom five states are Alabama, Kentucky, West Virginia, Arkansas, and Mississippi.
- Residents of Mississippi have life spans and earnings on par with those of the typical American in the late 1980s.
- In no state do African Americans or Latinos have well-being levels above those of whites or Asian Americans.
TWENTY-FIVE LARGEST METROPOLITAN AREAS
- The metro areas that perform best on the American HD Index are, starting from the top: Washington, D.C., San Francisco, Boston, Minneapolis-St. Paul, and New York. Workers in the top-ranked Washington, D.C. metro area make over $14,000 more than the typical American wage-earner, are more than twice as likely to have a graduate degree as other Americans, and live 2.2 years longer.
- The metro areas with the lowest levels of well-being are Detroit, Houston, Tampa, San Antonio, and, in last place, Riverside-San Bernardino. In Riverside-San Bernardino, one in five adults 25 and older never completed high school. Earnings are about $2,000 less per year than the national median.
- Consistent with the state-level analysis, in no major U.S. metropolitan area do either African Americans or Latinos have well-being levels that equal or exceed those of Asian Americans or whites.
This report was made possible by the generous support of the Conrad N. Hilton Foundation.
__________________________________________________________________________
For media and all other inquiries, contact us at: contact@measureofamerica.org.