Broad Recovery, Persistent Inequity: Youth Disconnection in America
LAUNCHED OCTOBER 31, 2024
FULL REPORT | INTERACTIVE TOOL
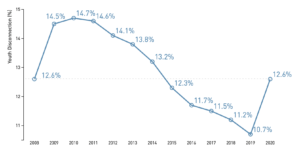
 For a dozen years, we have charted the highs and lows of youth disconnection in America. Over the last decade, we clocked a steady decline in the national youth disconnection rate as the country recovered from the Great Recession, a sharp upward spike in 2020 caused by Covid-19, and a return in 2022 to near-prepandemic levels. The 2022 national youth disconnection rate is 10.9 percent, or 4,343,600 disconnected youth—this rate represents a near-return to the pre-Covid rate of 10.7 percent in 2019. Despite the sharp-but-temporary pandemic-driven uptick in 2020 and 2021, the rate fell 22.7 percent between 2012 and 2022.
Broad Recovery, Persistent Inequity: Youth Disconnection in America is the latest in Measure of America’s series of annual reports on teens and young adults ages 16–24 years who are neither working nor in school, a group referred to as disconnected youth or opportunity youth. The youth disconnection rate is a vital metric of access to opportunity and societal well-being. People acquire skills, credentials, habits, and experiences fundamental to a rewarding, productive, and joyous life during their teens and early twenties. The youth disconnection rate thus tells us which young people in our society have the chance to lay the groundwork for freely chosen, flourishing lives and which groups face serious challenges in the transition to adulthood. Research shows that being disconnected as a young person has long-term consequences; it’s associated with lower earnings, less education, worse health, and even less happiness in later adulthood. Determining who remains disconnected, and why, is vital to identifying strategies and interventions, especially in the wake of the Covid-19 pandemic.
This year, four things stand out: first, stubborn gaps continue to separate racial and ethnic groups at the national, state, and metro area levels; second, though girls and young women have lower disconnection rates than boys and young men at the national level, in many places and among certain demographic groups, the female disconnection rate is higher than the male rate, a fact that gets too little attention; third, considerable variation exists among states and metro areas, with rates ranging from below 7 percent in greater Chattanooga, Boston, and Minneapolis-St. Paul to above 16 percent in Memphis, Bakersfield, and the McAllen-Edinburg-Mission metro area of Texas; and fourth, places differ sharply in terms of the progress made over the last decade.
Broad Recovery, Persistent Inequity presents 2022 youth disconnection rates for the United States as a whole as well as by gender, race and ethnicity, region, state, metro area, and congressional district. The report also offers recommendations on how to better serve out-of-school and out-of-work young people.

KEY FINDINGS

- National rate: The 2022 youth disconnection rate is 10.9 percent, or 4,343,600 young people.
- Changes in Enrollment and Employment: During the Covid-19 pandemic, the rise in the disconnection rate between 2019 and 2021 was accompanied by a decrease in both educational enrollment and employment. In 2022, as the youth disconnection rate returned to nearly pre-pandemic levels, enrollment and employment are on different trajectories: the increase in employment is the mirror image of the decline in disconnection, even as school enrollment continues to decline at a similar rate to the years during the peak of the pandemic.
- Gender: As in past years, girls and young women at the national level are less likely to be disconnected than boys and young men, 10.6 percent versus 11.2 percent. The size and direction of the gender gap varies by race and ethnicity and by place, however.
- Race and ethnicity: More than one in five Native American teens and young adults are neither working nor in school. The Native American youth disconnection rate is 21.9 percent, the highest of the United States’ six major racial and ethnic groups. Native Hawaiian and other Pacific Islander (NHOPI) teens and young adults have the second-highest disconnection rate, 19.4 percent, or 15,000 young people. NHOPI young people have the largest gender gap in the youth disconnection rate of any racial or ethnic group—16.3 percent for NHOPI boys and young men, compared to 22.7 percent for their female counterparts. The disconnection rate for Black young people is 16.8 percent, or 871,300 young people. About one in five opportunity youth are Black. The Latino youth disconnection rate stands at 12.8 percent, or 1,224,800 young people. As in past years, Latina girls and young women were slightly more likely than their male counterparts to be disconnected, 13.44 percent versus 12.2 percent. The disconnection rate for white teens and young adults is 8.9 percent, the second-lowest rate. White teens and young adults make up the largest absolute number of opportunity youth, 1,797,700 people. Asian teens and young adults have the lowest disconnection rate, 6.2 percent, or 133,200 young people. Rates vary widely by Asian subgroup, however, from a low of 4.8 percent for Korean young people to a high of 17.6 percent for Cambodian young people.
- Regions: The West South Central region, which comprises Arkansas, Louisiana, Oklahoma, and Texas, has the highest disconnection rate of any region in the United States, 13.1 percent. The New England region has the lowest disconnection rate of all US regions, 8.4 percent; it is home to 6 states: Connecticut, Maine, Massachusetts, New Hampshire, Rhode Island, and Vermont.
- States: North Dakota has the lowest youth disconnection rate (4.4 percent), followed by Nebraska (6.4 percent) and Washington, DC (6.9 percent). Louisiana has the highest rate (15.5 percent), followed by Mississippi (15.4 percent) and New Mexico (15.3 percent).
- Metro areas: Chattanooga, TN-GA (6.6 percent), boasts the lowest youth disconnection rate of the 100 most populous metro areas in the country, followed closely by Minneapolis–St. Paul–Bloomington, MN-WI and Boston-Cambridge-Newton MA-NH (both 6.7 percent). The highest youth disconnection rate can be found in McAllen-Edinburg-Mission, TX (18.5 percent), followed by Bakersfield-Delano, CA (17.2 percent), and Memphis, TN-MS-AR (16.5 percent).
- Congressional districts: Wisconsin’s 2nd Congressional District, which includes which includes state capital Madison and its surrounding suburbs and towns as well as the University of Wisconsin, has the lowest youth disconnection rate, 3.7 percent. Kentucky’s 5th Congressional District, which which encompasses rural Appalachia’s Southeastern Kentucky, is home to the highest youth disconnection rate, 21.1 percent.
For media and all other inquiries, contact us at: contact@measureofamerica.org
Ensuring an Equitable Recovery: Addressing Covid-19’s Impact on Education
LAUNCHED OCTOBER 3, 2023
FULL REPORT | INTERACTIVE TOOL | MEDIA RELEASE

Between 2010 and 2019, the youth disconnection rate fell 27 percent, driven largely by the steady increase in youth employment in the years following the Great Recession. The number of teens and young adults disconnected from both work and school in the United States was lower than it had been in over a decade. However, this trend was suddenly reversed with the arrival of the Covid-19 pandemic, as the rate increased a striking 13.1 percent between 2019 and 2021. The 2021 national youth disconnection rate is 12.1 percent, or 4,680,900 disconnected youth—an improvement on the 2020 rate, 12.6 percent, but still falling short of the pre-pandemic rate of 10.7 percent. Covid-19’s harmful and potentially persistent effects on young people cannot be underestimated. The pandemic not only robbed young people of important milestones, experiences, and opportunities, it also reversed a decade of progress in reducing youth disconnection. Now, taking the right steps to meet the needs of communities and individuals experiencing disconnection is critical.
Ensuring an Equitable Recovery: Addressing Covid-19’s Impact on Education is the latest in Measure of America’s series of annual reports on teens and young adults ages 16–24 years who are neither working nor in school, a group referred to as disconnected youth or opportunity youth. The youth disconnection rate is a vital metric of access to opportunity and societal well-being. People acquire skills, credentials, habits, and experiences fundamental to a rewarding, productive, and joyous life during their teens and early twenties. The youth disconnection rate thus tells us which young people in our society have the chance to lay the groundwork for freely chosen, flourishing lives and which groups face serious challenges in the transition to adulthood. Research shows that being disconnected as a young person has long-term consequences; it’s associated with lower earnings, less education, worse health, and even less happiness in later adulthood. Determining who remains disconnected, and why, is vital to identifying strategies and interventions, especially in the wake of the Covid-19 pandemic.
Covid-19-fueled learning loss set already vulnerable young people further behind their peers and at risk of being permanently scarred by lost educational opportunities. School enrollment for youth ages 16–24 dropped to 59.3 percent in 2021. Declining enrollment is especially notable for 18–19-year-olds; their 2.6 percent decrease from 2019 to 2021 is unprecedented in our analysis going back to 2006. Employment rates for young adults decreased as well, at roughly double the rate of enrollment, in the aftermath of Covid-19.These sharp losses have worsened the wide and long-standing gap in outcomes between rich and poor districts and, if not successfully addressed, may result in higher rates of high school dropout, fewer students transitioning from high school to postsecondary education, and fewer entry-level workers with the skills needed for many jobs in the coming years.
Another striking finding is that the share of all young people with at least one disability increased sharply between 2019 and 2021. In particular, the cognitive disability rate for young adults ages 16–24 increased 21.8 percent from 2019, far more sharply than it did for other age groups; Covid-19 or Covid-associated mental health challenges are the likely culprit. Though older people are more likely than younger ones to suffer from long Covid, youth are not immune, and young adults have suffered from Covid-era depression more acutely than older cohorts.
Ensuring an Equitable Recovery presents 2021 youth disconnection rates for the United States as a whole as well as by gender, race and ethnicity, region, state, metro area, and congressional district. The report also offers recommendations on how to better serve out-of-school and out-of-work young people.
KEY FINDINGS

- National rate: The 2021 youth disconnection rate is 12.1 percent, or 4,680,900 young people.
- Disability: In 2019, 6.7 percent of young adults ages 16–24 had a disability; in 2021, 7.8 percent of young adults did: 3,045,000 individuals. Due to the increased share of disability in young adults, an additional 457,400 young adults were disabled in 2021. The cognitive disability rate for young adults in this age group increased 21.8 percent from 2019, far more sharply than it did for other age groups; Covid-19 or Covid-associated mental health challenges are the likely culprits.
- Gender: As in past years, girls and young women at the national level are less likely to be disconnected than boys and young men, 11.5 percent versus 12.6 percent. The size of the gender gap varies by race and ethnicity, however.
- Race and ethnicity: Nearly one in four Native American teens and young adults are neither working nor in school. The Native American youth disconnection rate is 23.4 percent, the highest of the United States’ five major racial and ethnic groups. Black teens and young adults have the second-highest disconnection rate, 18.9 percent, or 966,300 young people. Black young people have the largest gender gap in the youth disconnection rate of any racial or ethnic group—16.4 percent for Black girls and young women, compared to 21.4 percent for their male counterparts. The Latino youth disconnection rate stands at 14.0 percent, or 1,286,200 young people. In past years, Latina girls and young women were slightly more likely than their male counterparts to be disconnected. In 2020, both rates sat at 14.0 percent, but in 2021, the female and male rates have separated again slightly, 14.1 percent versus 13.9 percent. The disconnection rate for white teens and young adults is 9.8 percent, the second-lowest rate. White teens and young adults make up the largest absolute number of disconnected youth, 1,946,500 people. Asian teens and young adults have the lowest disconnection rate, 6.9 percent, or 140,000 young people. Rates vary widely by Asian subgroup and gender, however, from a low of 3.4 percent for Korean girls and young women to a high of 17.6 percent for Hmong boys and young men.
- Regions: The East South Central region, which comprises Alabama, Kentucky, Mississippi, and Tennessee, has the highest disconnection rate of any region in the United States, 14.2 percent. New England and the West North Central regions are tied for the lowest disconnection rate of all US regions, 8.9 percent. New England, which is home to Connecticut, Maine, Massachusetts, New Hampshire, Rhode Island, and Vermont, has the lowest rates for Black (11.3 percent) and Asian (3.2 percent) young people. The West North Central region (Iowa, Kansas, Minnesota, Missouri, Nebraska, North Dakota, and South Dakota) has the lowest white youth disconnection rate, 7.6 percent, and the lowest Latino rate, 11.4 percent.
- States: North Dakota has the lowest youth disconnection rate (7.0 percent), followed by Iowa (7.1 percent) and Delaware (7.3 percent). New Mexico has the highest rate (20.5 percent), followed by Louisiana (17.7 percent) and Alaska (16.5 percent).
- Metro areas: Provo-Orem, UT (6.8 percent), boasts the lowest youth disconnection rate of the 100 most populous metro areas in the country, followed by Ogden-Clearfield, UT (also 6.8 percent due to rounding but nonetheless a hair behind Provo-Orem), and Boston-Cambridge-Newton MA-NH (7.0 percent). The highest youth disconnection rate can be found in Memphis, TN-MS-AR (19.9 percent), followed by Stockton, CA (19.8 percent), and McAllen-Edinburg-Mission, TX (19.3 percent).
- Congressional districts: Iowa's 3rd Congressional District, which includes Des Moines and the southwestern portion of the state, has the lowest youth disconnection rate, 5.2 percent. New York’s 15th Congressional District, which includes New York City’s South Bronx as well as western portions of the Bronx, is home to the highest youth disconnection rate, 24.5 percent; it is also the poorest of the country’s 435 Congressional Districts.
For media and all other inquiries, contact us at: contact@measureofamerica.org
The Pandemic has Worsened Youth Disconnection, Exacerbated Inequality, Report Finds
April 5, 2022 — Marketplace
A Disrupted Year: How the Arrival of Covid-19 Affected Youth Disconnection
To see the most recent data, check out our interactive tool on youth disconnection.
LAUNCHED MARCH 31, 2022
FULL REPORT | INTERACTIVE TOOL | MEDIA RELEASE| LAUNCH WEBINAR
On the eve of the Covid-19 pandemic, the number of teens and young adults disconnected from both work and school in the United States was lower than it had been in over a decade. Between 2010 and 2019, the youth disconnection rate fell 27 percent, driven largely by the steady increase in youth employment in the years following the Great Recession. The 2020 national youth disconnection rate is 12.6 percent, or 4,830,700 disconnected youth—an upward spike that reverses a decade-long trend of falling rates. The rate increase signals a Covid-fueled reversal of the decade-long decline in the share of the country’s young people neither working nor in school. In addition, due to Covid-related data challenges, the report argues that this rate is likely an underestimate of the true extent of disconnection in the first year of the pandemic; in other words, the youth disconnection rate for 2020 is at least this high and very likely higher.
A Disrupted Year: How the Arrival of Covid-19 Affected Youth Disconnection is the latest in Measure of America’s series of annual reports on teens and young adults ages 16–24 years who are neither working nor in school, a group referred to as disconnected youth or opportunity youth. The youth disconnection rate is a vital metric of access to opportunity and societal well-being. People acquire skills, credentials, habits, and experiences fundamental to a rewarding, productive, and joyous life during their teens and early twenties. The youth disconnection rate thus tells us which young people in our society have the chance to lay the groundwork for freely chosen, flourishing lives and which groups face serious challenges in the transition to adulthood. Research shows that being disconnected as a young person has long-term consequences; it’s associated with lower earnings, less education, worse health, and even less happiness in later adulthood. Determining who remains disconnected, and why, is vital to identifying strategies and interventions, especially in the wake of the Covid-19 pandemic.
The Covid-19 pandemic continues to pose countless health, educational, and economic challenges. The events of 2020 deprived America’s young people of a host of experiences that would have allowed them to build the capabilities required to live flourishing lives as adults. In addition, the burden of the Covid-19 pandemic has fallen disproportionately on low-income communities of color, which are also disproportionately home to the highest rates of youth disconnection.
A Disrupted Year presents 2020 youth disconnection rates for the United States as a whole as well as by gender, race and ethnicity, region, state, metro area, and congressional district. The report also offers recommendations on how to better serve out-of-school and out-of-work young people.
KEY FINDINGS
 National rate: The 2020 youth disconnection rate is 12.6 percent, or 4,830,700 young people.
- Data challenges: The onset of the Covid-19 pandemic severely disrupted the federal statistical collection and curation processes. These disruptions resulted in lower American Community Survey response rates not only from the very groups most likely to be out of school and work, such as low-income, Black, and Latino households, but also during the initial months of the pandemic, when the economy shed literally millions of jobs. Although the Census Bureau took several steps to shore up the 2020 survey data by cross-referencing additional government data sources, the Bureau nonetheless released these data with a host of caveats and urged users to exercise caution when making comparisons to previous years’ data. These caveats suggest that the estimates we provide in this report understate the magnitude of youth disconnection in 2020; we believe that the actual rates, in other words, are at least this high and likely higher. That said, these data are still the most comprehensive and reliable available.
- Gender: As in past years, girls and young women are less likely to be disconnected than boys and young men, 12.1 percent versus 13.2 percent. The size of the gender gap varies by race and ethnicity, however.
- Race and ethnicity: Nearly one in four Native American teens and young adults are neither working nor in school. The Native American youth disconnection rate is 23.4 percent, the highest of the United States’ five major racial and ethnic groups. Black teens and young adults have the second-highest disconnection rate, 19.6 percent, or 982,900 young people. Black young people have the largest gender gap in the youth disconnection rate of any racial or ethnic group—16.6 percent for Black girls and young women, compared to 22.5 percent for their male counterparts. The Latino youth disconnection rate stands at 14.0 percent, or 1,258,700 young people. In past years, Latina girls and young women were slightly more likely than their male counterparts to be disconnected, but in 2020, the male and female rates were the same, 14.0 percent. The disconnection rate for white teens and young adults is 10.6 percent, the second-lowest rate. White teens and young adults make up the largest absolute number of disconnected youth, 2,087,800 people. Asian teens and young adults have the lowest disconnection rate, 7.3 percent, or 156,100 young people. Rates vary widely by Asian subgroup and gender, however, from a low of 4.5 percent for Chinese and Japanese boys and young men to a high of 18.8 percent for Cambodian boys and young men.
- Regions: The West South Central region, which comprises Arkansas, Louisiana, Oklahoma, and Texas, has the highest disconnection rate of any region in the United States, 14.6 percent. The West North Central region has the lowest disconnection rate of all US regions, 9.9 percent; it is home to seven states: Iowa, Kansas, Minnesota, Missouri, Nebraska, North Dakota, and South Dakota.
- States: Nebraska has the lowest youth disconnection rate (7.8 percent), followed by New Hampshire (8.3 percent) and Minnesota (8.6 percent). New Mexico has the highest rate (19.6 percent), followed by Alaska (19.5 percent) and Arkansas (17.4 percent).
- Metro areas: Provo-Orem, UT (6.9 percent), boasts the lowest youth disconnection rate of the 100 most populous metro areas in the country, followed by San Jose-Sunnyvale-Santa Clara, CA (7.0 percent), and Madison, WI (8.2 percent). Although Madison has one of the lowest rates overall, the rate for Black young people in that metro area is very high, 21.2 percent. The highest youth disconnection rate can be found in Albuquerque, NM (19.7 percent), followed by Bakersfield, CA (19.6 percent), and McAllen-Edinburg-Mission, TX (18.8 percent).
- Congressional districts: California’s 52nd congressional district, which includes the bulk of the city of San Diego, has the lowest youth disconnection rate (5.3 percent). Michigan’s 14th congressional district, which includes some of the lowest-income neighborhoods in Detroit, is home to the highest youth disconnection rate, 25.0 percent.
For media and all other inquiries, contact us at: contact@measureofamerica.org
A Decade Undone: 2021 Update
To see the most recent data, check out our interactive tool on youth disconnection.
LAUNCHED JULY 29, 2021
FULL REPORT | INTERACTIVE TOOL | MEDIA RELEASE
 A Decade Undone: 2021 Update, a follow-up to last year’s A Decade Undone: Youth Disconnection in the Age of Coronavirus, presents 2019 youth disconnection rates for the United States as a whole as well as by gender, race and ethnicity, region, state, metro area, county, congressional district, and public use microdata area (PUMA). These pre-coronavirus numbers create a map of vulnerability; they highlight where disconnection rates were already highest and therefore where the situation today is most precarious.
The number of teens and young adults disconnected from both work and school in the United States fell for the ninth year in a row, from a recession-fueled high of 14.7 percent in 2010 to 10.7 percent in 2019. The Covid-19 pandemic has caused youth disconnection rates to spike dramatically. We estimate, based on currently available youth unemployment data from the Bureau for Labor Statistics, enrollment and employment data from the Census Current Population Survey, and school closure information, that in May 2020 as many as nine million young people were out of school and out of work, more than twice as many as in 2019. Given the decline in youth unemployment in the second half of 2020, we anticipate that the number for 2020 as a whole will be closer to six million—considerably higher than in the years after the Great Recession. With students physically disconnected from schools and unemployment the highest it’s been since the Great Depression, young people with the fewest resources will be left even further behind their peers and face the highest barriers to reconnection. While it is clear that young people of all stripes will suffer, low-income people of color will be the hardest hit.
In the conclusion to this report, Measure of America identifies thirty “post-pandemic priority counties” where the combination of already-high youth disconnection rates (24 percent and up) and lengthy stretches of virtual-learning education during the 2020–2021 academic year has created an educational emergency. In these counties with high rates of disconnection and school closures, already- and newly-disconnected youth urgently need assistance to close preexisting educational gaps, regain the ground they lost in 2020, reconnect to the education system, and receive the help they need to gain a foothold in the labor market.
KEY FINDINGS
- Nationally: The 2019 youth disconnection rate is 10.7 percent, or one in nine young people, down from 11.2 percent in 2018. The country’s disconnected youth are nearly twice as likely to live in poverty, more than three times as likely to have a disability, more than twice as likely to lack health insurance, and more than twenty times more likely to be institutionalized compared to connected youth. Disconnected youth 21-24 years old are less than half as likely to have a bachelor’s degree as their connected counterparts. Disconnected young women are over four times as likely to be mothers as their connected peers.
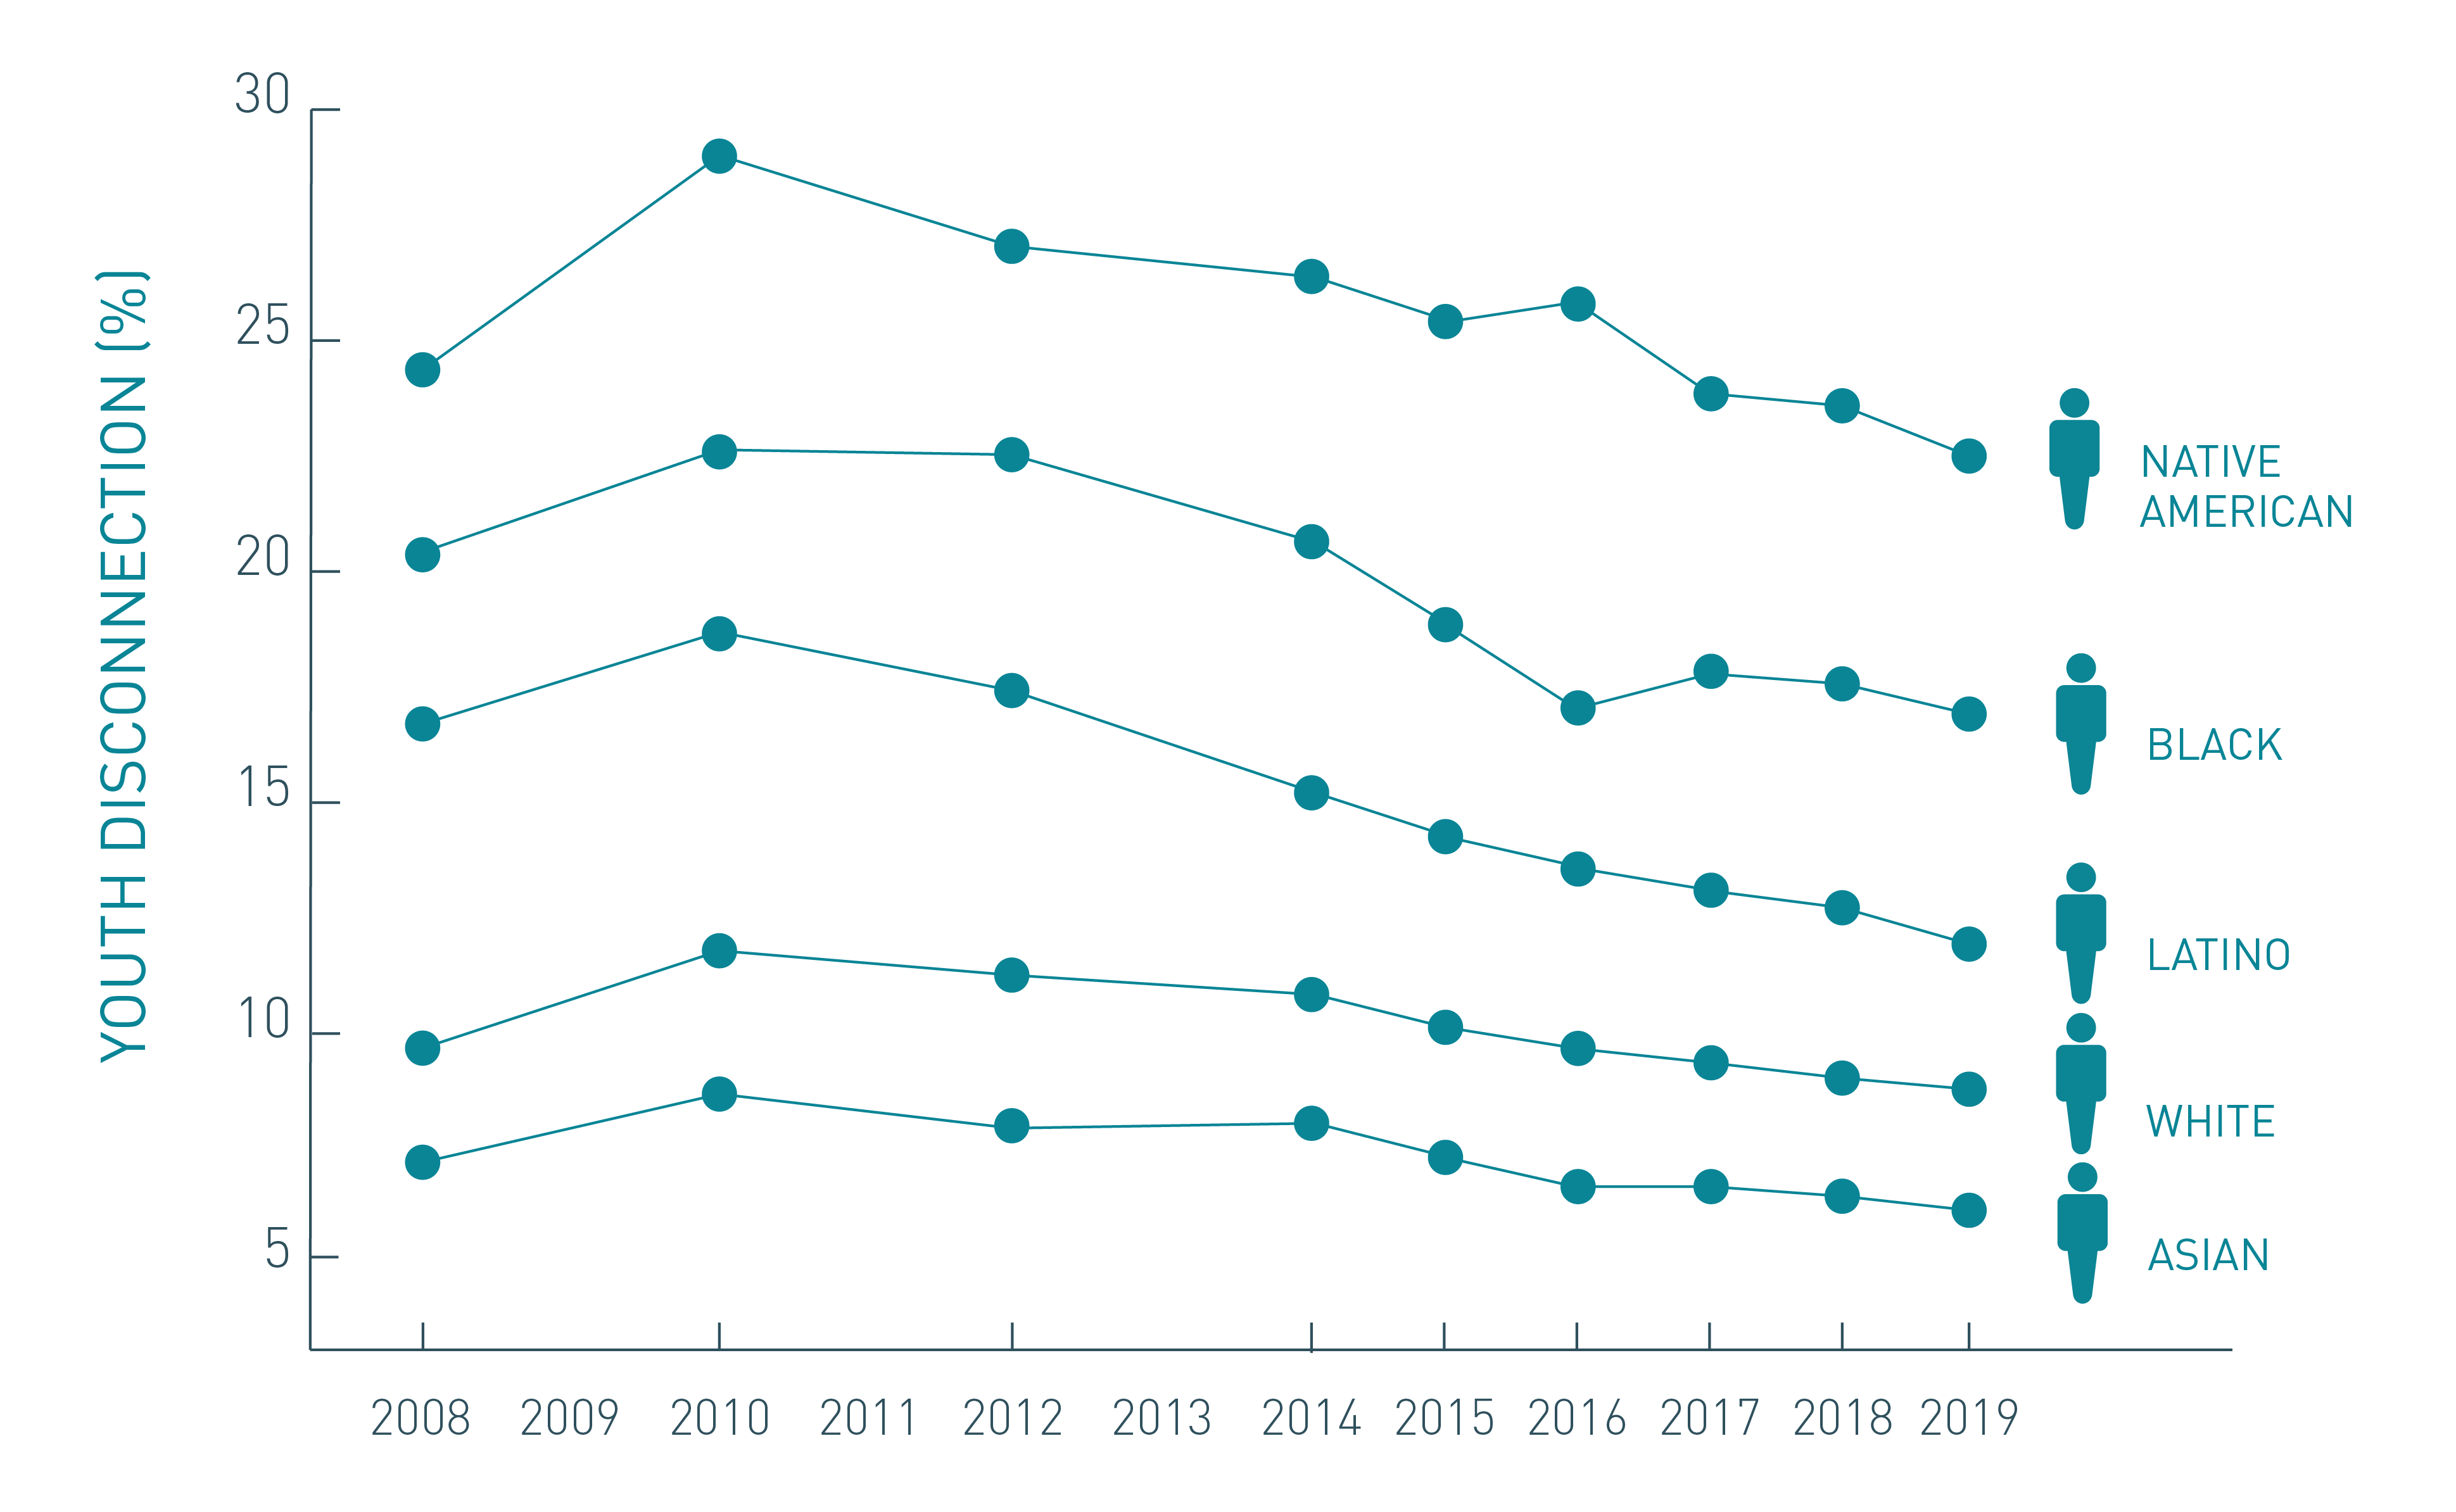
- Race and ethnicity: Native American youth had the highest disconnection rate (22.1 percent) of any major racial or ethnic group, followed by Black (16.7 percent), Latino (12.1 percent), white (8.8 percent), and Asian (5.7 percent) young people. Across all these groups, youth disconnection fell from 2018 to 2019.
- Gender: Women had a lower youth disconnection rate (10.3 percent) than men (11.0 percent); however, this gap varied by race and ethnicity. The largest racial gender gap existed between Black young women (13.7 percent) and Black young men (19.5 percent). Native American men’s youth disconnection rate of 23.3 percent was the highest for any race/gender combination.
- Public use microdata areas (PUMAs): PUMAs are areas defined by the US Census Bureau; they have populations of at least 100,000 people. To create these geographies, urban counties are split into many PUMAs (Los Angeles has 69, for example) and sparsely populated rural counties are joined together. The result is places with similarly-sized population groups that allow for apples-to-apples comparisons. The ten best-performing PUMAs can all be found in affluent sections of large cities or in well-to-do suburbs of major metro areas, and all have youth disconnection rates below 3 percent. The ten PUMAs facing the greatest challenges have youth disconnection rates that range from 28.9 percent to 35.0 percent. Two types of communities are found in this group: low-income, majority-minority neighborhoods in large metro areas, and isolated rural areas characterized by long-term, deep poverty.
- States: North Dakota has the lowest youth disconnection rate of any state (6.6 percent) and Alaska has the highest (18.7 percent). Washington D.C. experienced the largest increase in the share of disconnected young people, from 10.7 percent in 2018 to 15.6 percent in 2019. Idaho saw the largest drop in disconnection from 13.1 percent in 2018 to 8.6 percent in 2019, a decrease of 34 percent.
- Metro areas: Boston-Cambridge-Newton, MA-NH (6.0 percent) boasts the lowest disconnection rate of any metro area in the country. The highest rate of disconnection can be found in Augusta-Richmond County, GA-SC (17.9 percent).
- Counties: Rural counties have by far the highest average rate of youth disconnection, 17.3 percent; suburban counties have the lowest, 9.9 percent. County youth disconnection rates have the greatest range of any unit of geography. Virginia’s Harrisonburg City, a small city, has the lowest rate of youth disconnection in the country (2.2 percent), while the East Carroll Parish in Louisiana has the highest youth disconnection rate (81.0 percent).
- Congressional Districts: Colorado District 2, which includes suburbs north and west of Denver, has the lowest rate (3.8 percent). The congressional district with the highest rate of youth disconnection is District 1 in Nevada (20.7 percent), which includes Las Vegas and surrounding towns.
Youth, Disconnected: Coronavirus Shutdown Leaves Some Behind
May 1, 2020 — Pew Charitable Trusts
McDonald’s Youth Opportunity Program Engages Over 4,200 Chicago Youth
July 18, 2019 — Chicago Defender
Here’s How We Can Boost Youth Employment
June 5, 2019 — OZY
Making the Connection
Making the Connection: Transportation and Youth Disconnection
To see the most recent data, check out our interactive tool on youth disconnection.
LAUNCHED APRIL 25, 2019
FULL REPORT | INTERACTIVE TOOL | MEDIA RELEASE
Read the companion congressional district brief.
Since its peak in the aftermath of the Great Recession, the number of teens and young adults disconnected from both work and school in the United States fell for the seventh year in a row. The 2017 disconnection rate is 11.5 percent, a significant drop from the post-recession high of 14.7 percent in 2010. But a look into the latest data also shows some causes for concern. First, the decrease in the national disconnection rate between 2016 (11.7 percent) and 2017 (11.5 percent) was negligible. Second, for some groups, progress has halted or even reversed. The youth disconnection rate for black teens and young adults increased between 2016 and 2017. And despite years of decline in the country’s overall
disconnection rate, disparities between racial and ethnic groups persist. These findings indicate we cannot rely on economic growth alone to solve the problem of youth disconnection in America—societal factors such as poverty, discrimination, and residential segregation also play significant roles.
Making the Connection: Transportation and Youth Disconnection presents the latest available data on youth disconnection for the United States as a whole as well as disconnection rates by gender, race and ethnicity, region, state, and metro area. Determining who remains disconnected, and why, is vital to identifying interventions that will sustain or accelerate the positive trend we have observed over the past seven years. Because reducing youth disconnection will require an understanding of the structural factors driving it, the report also examines a key factor preventing young people from staying in school and the workforce: disparities in access to reliable and affordable transportation. Future reports will address additional structural barriers fueling disconnection.
KEY FINDINGS
- Nationally: The youth disconnection rate for the United States overall was 11.5 percent in 2017—down from 11.7 percent the previous year. This represents a total of about 4.5 million young people, or about one in nine.
- Disability: Disconnected young people are more than three times as likely to have a disability of some kind than connected young people—16.6 percent as compared to 5.0 percent. White male disconnected youth have the highest disability rate, 23.0 percent, but in general face fewer structural barriers to school persistence and employment than other groups.

- Gender: Boys and young men are slightly more likely to be disconnected than girls and young women, 11.9 percent as compared to 11.1 percent. But this ranking varies by race; among Asian, Latino, and Native American youth, young women have a slightly higher disconnection rate, whereas for black and white youth, young men do. The size of the gender gap is largest for black young people.
- Race and ethnicity: Of the country’s five major racial and ethnic groups, Asian American youth have the lowest disconnection rate, 6.6 percent, unchanged from their 2016 rate. White youth have the second-lowest rate (9.4 percent), followed by Latino (13.2 percent), black (17.9 percent), and Native American youth (23.9 percent). Latino youth saw the greatest improvement in their disconnection rate between 2016 to 2017, while black teens and young adults are the only group whose disconnection rate increased. Disconnection rates also vary by Asian and Latino subgroup.
- Regions: Disconnection continues to be a particular challenge in the South. The East South Central area, which includes Kentucky, Tennessee, Mississippi, and Alabama, has the highest disconnection rate overall, 14.2 percent. New England has the lowest rate, 8.26 percent.
- States: Minnesota has the lowest rate of youth disconnection (6.2 percent), followed by Iowa (7.0 percent) and Massachusetts (7.1 percent). West Virginia has the highest rate, 17.0 percent, followed by New Mexico (16.5 percent) and Mississippi (16.4 percent). Idaho experienced the largest increase in the share of disconnected young people between 2016 and 2017, nearly 25 percent. The state’s 2017 rate of 13.6 percent is almost as high as its 2014 peak of 14.0 percent. Alaska saw the largest drop in its disconnection rate, a decrease of 27 percent.
- Metro areas: Metro area youth disconnection rates range from a low of 5.6 percent in greater Grand Rapids, Michigan, to a high of 18.0 percent in the Memphis metro area. Metro area disconnection rates vary by gender as well as race and ethnicity. The metro area with the largest racial or ethnic gap is Louisville, KY-IN, where the black-white gap is 17.6 percentage points.
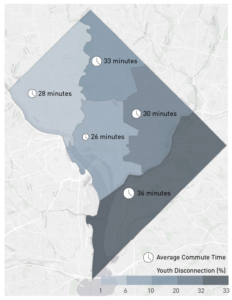
- Transportation: An examination of disconnection rates and commute times in two major cities, Washington, DC, and Chicago, reveals a link between transportation and youth disconnection. Average commute time and the youth disconnection rate are strongly correlated across DC neighborhoods. The correlation between the youth disconnection rate and the percentage of workers with very long commutes is also strong. In Chicago, the five areas with the highest youth disconnection rates, all above 20 percent, also have the highest rates of workers commuting an hour or more each way.
RECOMMENDATIONS
Through our research and engagement with stakeholders over the years, we have learned in greater detail about the challenges related to youth disconnection, as well as what works in addressing them. Though they overlap, these challenges and related recommendations can be organized into four very general buckets: confronting historical and intergenerational disadvantage, especially racism; supporting vulnerable youth; keeping youth connected; and reengaging disconnected youth. Read about challenges and recommendations here.
“Since its first report on the topic in 2012, Measure of America has provided rigorous and informative analysis of the experiences of this significant youth population.This report exemplifies the SSRC’s commitment to research that advances the public good and informs public debate.”
—Alondra Nelson, President of the Social Science Research Council
“At the Schultz Family Foundation, we believe every young person has the potential to succeed, and we’re committed to using research and data to inform both our efforts and the larger field of practice. Today’s report from Measure of America reinforces the importance in investing in this next generation of young people.”
—Daniel Pitasky, Executive Director of the Schultz Family Foundation
“Young people are the future of America. This could not be any clearer based upon the Measure of America work and report. Bias against any racial, ethnic or regional group that impedes the growth and development of this crucial segment of America’s population is not only cruel and unfair; it threatens the future social and economic prosperity and well-being of the nation. We must do all we can to make sure that all of America’s youth stay connected and committed to the future development and growth of America. It is not only the right thing to do, it is the smart course of action for our nation’s leaders.”
—James S. Jackson, Daniel Katz Distinguished University Professor of Psychology at the University of Michigan
Promising Gains, Persistent Gaps
To see the most recent data, check out our interactive tool on youth disconnection.
LAUNCHED MARCH 8, 2017
FULL REPORT | INTERACTIVE TOOL | MEDIA RELEASE
Read the congressional districts brief here.
Check out Measure of America and LeadersUp’s white paper on youth disconnection in Chicago.
Since Measure of America first wrote about youth disconnection half a decade ago, public awareness of both the plight and the promise of young people who are not in either school or the workforce has grown by leaps and bounds. Support for alternative school-to-work pathways like apprenticeships and career-technical education have seen a resurgence, the business-led 100,000 Opportunities Initiative met its goal to hire one hundred thousand disconnected youth well ahead of schedule, and at the time of writing, the Opening Doors for Youth Act of 2016 was introduced in Congress to make available significant federal investment to reconnect young people to school and employment.
Thanks to a greatly improved economy and efforts like those described above, the country has made real progress in tackling this important issue; this is good news we should all celebrate. But challenges remain: 4.9 million young women and men are still disconnected from the educational and employment opportunities required for rewarding, productive lives. If all disconnected youth lived together in a single state, that state would have roughly the population of South Carolina or Colorado. This report takes a look at who comprises this remaining group, what particular challenges they face, and what strategies have been shown to work.
Key findings include:

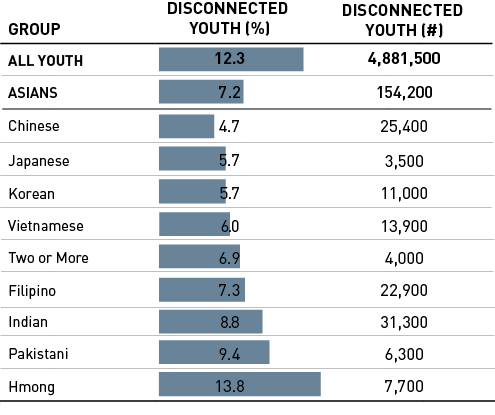
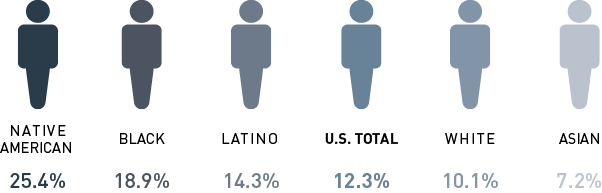
• Overall. In 2015, 4.9 million young adults between the ages of 16 and 24 were disconnected—12.3 percent of American youth, about one in eight. This is a significant drop from the post-recession high of 14.7 percent, over 5.8 million youth, in 2010.
• Rural-urban divide. This research shows that rural counties as a whole are faring considerably worse than more populous counties in terms of youth disconnection. In completely rural counties, the youth disconnection rate is 20.3 percent, much higher than the rate for counties in urban centers (14.2 percent) or for suburban counties (12.3 percent). Rural counties in the South have a particularly high rate: 24.0 percent—double the national rate.
• Race and ethnicity. There is astonishing variation in disconnection rates by race and ethnicity, ranging from nearly one in fourteen Asian American youth to more than one in four Native American young people. The Asian American youth disconnection rate is 7.2 percent; the white rate is 10.1 percent; the Latino rate is 14.3 percent; the black rate is 18.9 percent; and the Native American rate is 25.4 percent. Though the rate varies among Asian subgroups, most are performing well on this indicator; only Hmong Americans have a rate of youth disconnection that surpasses the US average.
• Women and men. Nationally, girls and young women are slightly less likely to be disconnected than boys and young men, 12.0 percent vs. 12.5 percent, a small but statistically significant difference. The difference in youth disconnection rates between genders plays out differently for each race or ethnic group.
• States. Young people are disconnected at rates that range from under 8 percent in some states (New Hampshire, Nebraska, North Dakota, Vermont, Minnesota, and Iowa) to over twice that in others, with New Mexico (17.4 percent), West Virginia (17.0 percent), and Mississippi (16.7 percent) facing the greatest challenges.
• Black-white gaps. Measure of America calculated the disconnection rate for blacks, Latinos, and whites at the state level when data allowed. The black-white disparity is so stark that even in states where white youth are faring the worst, they are still doing better than US blacks on average, and even in states where blacks are faring the best, they are still not doing as well as US whites on average.
• Top and bottom metro areas. Among the country’s ninety-eight most populous metro areas, greater Albany, NY (6.5 percent), Grand Rapids, MI (6.8 percent), and Omaha, NE-IA (7.1 percent) had the lowest youth disconnection rates. The Bakersfield, CA (18.7 percent), McAllen, TX (19.7 percent), and Augusta, GA-SC (21.0 percent) metro areas had the highest rates.
• Congressional districts. Youth disconnection rates vary enormously by congressional district—from an impressively low rate of 4.4 percent in Wisconsin District 2, the mostly urban Madison area, to an alarmingly high rate of 23.1 percent—or nearly one in every four young people—in Kentucky District 5 in rural Appalachia. On average, a gap of 7.4 percentage points separates the best and worst districts within a state.
• Impact of poverty. For young people of all races, the probability of disconnection falls as household incomes rise. White youth in affluent households are less likely to be disconnected than white youth in poor households, and the same is true for the other racial and ethnic groups; however, blacks, Latinos, and Native Americans are more likely to be disconnected than whites and Asians given the same income level. In fact, the rate of youth disconnection for Asian Americans in households with almost no income is the same as that for black youth in households with incomes close to five times the federal poverty line. Native American youth living in households with incomes at five times the poverty line face roughly the same probablity of disconnection as white youth living in households with incomes well below the poverty line.
• Biggest improvements. Between 2010 and 2015, Washington, DC made the greatest progress, with a 43.9 percent reduction in the rate of youth disconnection. New Hampshire had the second-largest drop, nearly 32 percent, and now has the lowest rate of any state.
__________________________________________________________________________
For media and all other inquiries, contact us at: contact@measureofamerica.org | (718) 517-3720.