DATA2GOHEALTH.NYC
DATA2GOHEALTH.NYC is a free, easy-to-use data tool you can use on your phone or computer. Measure of America created DATA2GOHEALTH.NYC with funding from The Leona M. and Harry B. Helmsley Charitable Trust.
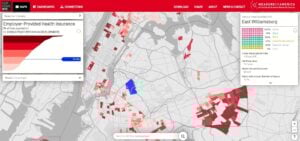
DATA2GOHEALTH.NYC brings together federal, state, and city data on all things health, for all New Yorkers. The website includes over 300 indicators for New York City neighborhoods, and about half of these indicators are available by community district, and almost a quarter by census tract.
DATA2GOHEALTH.NYC builds on DATA2GO.NYC, its sister tool, and provides reliable, up-to-date information on neighborhood assets and challenges across a broader range of health sectors. Health is more than your genetics or the results of your annual physical, and understanding the full spectrum of health determinants is crucial to understanding health outcomes. These two tools are for everyone—to craft effective solutions, target policies and services, advocate for change, and hold elected officials accountable for human progress.
The data come predominantly from public entities, including the US Census Bureau, the New York State Department of Health, and New York City agencies responsible for promoting the well-being of New Yorkers in many areas: health, education, public safety, and more.
The following geographic units are used in the tool:
- NYC
- The five boroughs
- 59 community districts OR 55 public use microdata areas OR 42 United Hospital Fund areas. These are all noted as CDs, PUMAs, or UHF areas.
- 188 neighborhood tabulation areas (NTAs)
- 2,166 census tracts
City- and borough-level data are available for almost all of the indicators in DATA2GOHEALTH.NYC The CD-, UHF-, and NTA-level data primarily come from New York City agencies, particularly the Department of Health and Mental Hygiene. PUMA- and census-tract-level data primarily come from the US Census Bureau.
The default for the tool is to display all data at the smallest available geography. The user can toggle geographies on and off, but we recommend using the default setting of all geographies turned on.
For more detailed information, see the FAQ and tutorial.
***
Measure of America is a nonpartisan research and advocacy initiative of the Social Science Research Council . We breathe life into numbers, providing easy-to-use yet methodologically sound tools for understanding well-being and opportunity in America. We work with partners to measure what matters and believe that everyone deserves the chance to live a freely chosen, flourishing life.
The Helmsley Charitable Trust aspires to improve lives by supporting exceptional efforts in the US and around the world in health and select place-based initiatives.
SUGGESTED ATTRIBUTION:
Measure of America, Social Science Research Council. 2018. DATA2GOHEALTH.NYC. http://www.data2gohealth.nyc.
DATA2GOHEALTH.NYC TEAM
Concept & Project Direction: Kristen Lewis & Becky Ofrane, Measure of America; Rosten Woo
Design: Rosten Woo
Data collection and much more: Rupsha Basu, Lily Canaan, Rebecca Gluskin, Yo Jeremijenko, Laura Laderman, Brianna Noonan, Becky Ofrane, Marina Recio, Abby Tremel, Anne Vierse, and Jamala Wallace.
Application development and coding: Codie Joseph See
Logo and MOA brand identity: Humantific
ADVISORY COMMITTEE
Shoshanah Brown
AIRnyc
Alan Cohen
JASA
Lisa David
Public Health Solutions
Nichola Davis
OneCity Health, NYC Health and Hospitals
Maida Galvez
Mount Sinai Pediatric Environmental Health
Aviva Goldstein
Fund for Public Health NYC
Hannah Gould
NYC Department of Health and Mental Hygiene
Charon Gwynn
NYC Department of Health and Mental Hygiene
Polina Hanin
StartUp Health
Terry Huang
CUNY Graduate School of Public Health and Policy
Andrea Mata
NYC Housing Authority
Denis Nash
CUNY Institute for Implementation Science in Population Health
Remle Newton-Dame
OneCity Health, NYC Health and Hospitals
Sharon Perlman
NYC Department of Health and Mental Hygiene
Charles Platkin
Hunter College Food Policy Center
Laura Pugliese
HITLAB
Asa Radix
Callen-Lorde Community Health Center / NYU
Fernando Tirado
NYC Department of Health and Mental Hygiene
Abbie Watts
Community Food Advocates
Susan Yee
Community Healthcare Network
OurHome.NYC
Interactive Tool to Measure Well-Being Among NYCHA Residents
Access the tool here.
OurHome.NYC is a free, easy-to-use online mapping and data tool that depicts the relationship between health, as measured by life expectancy, and housing across more than 300 New York City Housing Authority (NYCHA) developments. NYCHA residents, policymakers, and community-based organizations can view and compare over 150 health-related indicators to make informed decisions, advocate for change, and better understand a development or neighborhood.
OurHome.NYC features life expectancy estimates produced by the U.S. Small-Area Life Expectancy Estimates Project (USALEEP), a partnership of the National Center for Health Statistics, the National Association for Public Health Statistics and Information Systems, and the Robert Wood Johnson Foundation. Measure of America created this tool with support from the Urban Institute, using funds provided by the Robert Wood Johnson Foundation. We thank them for their support but acknowledge that the findings and conclusions presented in this tool are those of the author(s) alone, and do not necessarily reflect the opinions of the Urban Institute or the Robert Wood Johnson Foundation.
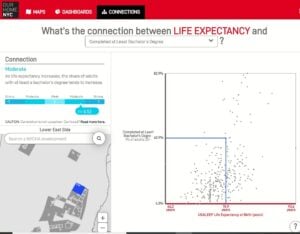
A snapshot of OurHome.NYC, looking at the relationship between life expectancy and education
For more information: contact@measureofamerica.org
A Portrait of New York City 2018
LAUNCHED JUNE 21, 2018 | FULL REPORT | MEDIA RELEASE | FIVE NEW YORKS PHOTO ESSAY
INTERACT WITH THE DATA: Well-Being in NYC Map | Five New Yorks Map
Click here to view the interactive webinar, Harnessing the Power of Data, on August 9th, 2018.
RELATED PROJECTS: See the “mini-portraits” made by service-delivery organizations for the Community Portraits Project and explore 300+ well-being indicators on DATA2GO.NYC.
 A Portrait of New York City 2018: Well-Being in the Five Boroughs and the Greater Metro Area examines well-being and access to opportunity for different geographies and demographic groups in New York City and the greater New York–New Jersey–Connecticut metropolitan area using the human development framework and index. This report also examines a range of issues that contribute to and/or are compounded by the well-being challenges faced by many New York City communities, such as child poverty, health inequities, racism, and residential segregation.
The American Human Development Index, a supplement to the gross domestic product and other money metrics, tells the story of how ordinary people are doing. The index is based on the Human Development Index developed by the United Nations, the gold standard for measuring the well-being of people in every nation.
This report presents the ranked index for 170 neighborhood and town clusters in the New York metro area; for the five boroughs and for 188 neighborhood tabulation areas in New York City; for the four major racial and ethnic groups; for women and men; and for US- and foreign-born residents.
KEY FINDINGS
AMERICAN HUMAN DEVELOPMENT INDEX: NEW YORK METRO AREA
- The American Human Development Index score for the greater New York metro area (6.32) is higher than the score for the city proper (5.98) and the United States as a whole (5.17).
- Despite a longer life expectancy and higher education levels, women scor
 e slightly lower than men on the index (6.25 vs. 6.30) due to a $12,500 gender earnings gap.
 - Of the four major racial and ethnic groups studied in this report, Asian metro area residents score highest on the HD Index, followed by white, black, and Latino residents. The Asian and white scores are similar (7.54 and 7.16, respectively), as are the black and Latino scores (4.87 and 4.83).
- The top-scoring neighborhood and town cluster of the 170 analyzed in the metro area is the Upper East Side in New York City (9.36). This area also scores highest in terms of education. The highest earnings are also found in Manhattan, in Battery Park City, Greenwich Village, and Soho. Southeast Westchester County fares best in terms of life expectancy.
- Southwest Newark, New Jersey has the lowest HD Index score and the lowest average life expectancy. The Hunts Point, Longwood, and Melrose section of the Bronx has the lowest education score, and Belmont, Crotona Park East, and East Tremont, also in the Bronx, has the lowest earnings.
AMERICAN HUMAN DEVELOPMENT INDEX: NEW YORK CITY
- New York City scores 5.98 out of 10 on the American Human Development Index, higher than the United States but lower than the New York metro area. The city also has higher highs and lower lows than the greater metro area.
- On average, Asian and white New Yorkers enjoy relatively high levels of well-being, while black and Latino New Yorkers have HD Index scores below the city average. White residents have the highest score (7.63) and Latino residents have the lowest (4.58).
- Women score higher than men on the HD Index (6.16 vs. 5.87) due to higher average life expectancies and education levels.
- Carnegie Hill on the Upper East Side has the highest score (9.34) of all 188 NYC neighborhood tabulation areas. Of the ten highest-scoring neighborhoods, nine are in Manhattan and one is in Brooklyn. All ten lowest-scoring neighborhoods are in the Bronx. Claremont-Bathgate scores the lowest (2.71).
- HD Index scores can be used to track improvements over time, but in a city where neighborhoods are rapidly transforming, it can be difficult to determine if rising well-being levels are due to better outcomes for existing residents or to changes in population demographics. According to an analysis of the racial compositions of the fifty-nine NYC community districts since 2000, the black share of the population has decreased by more than 5 percentage points in fourteen neighborhoods. At the same time, many traditionally black and Latino neighborhoods experienced an influx of white residents.
A Long and Healthy Life
- A child born today in New York City can expect to live for 82.3 years. If New York City were a country, it would rank eighth in life expectancy, tied with Sweden.
- Foreign-born New Yorkers can expect to live six years longer, on average, than those born in the United States. This life expectancy advantage tends to fade the longer immigrants live in the United States.
- There is a five-year life expectancy gap between NYC men (80.2 years) and women (85.3 years).
- More than a decade separates the life expectancy of the city’s Asian residents (89.3 years) and its black residents (79.2 years). Latinos and whites fall between the two; Latinos are the second-longest-lived group (83.5 years), and whites are the third (82.6 years).
- There is a thirteen-year difference in life expectancy between the longest- and shortest-lived NYC community district; residents of Bayside, Douglaston, and Little Neck in Queens have a life expectancy of 89.6 years, compared to a 76.7-year life expectancy for residents of Brownsville and Ocean Hill in Brooklyn.
- Heart disease and cancer are the two leading causes of death across all four racial and ethnic groups, but black New Yorkers are more likely to die from preventable causes such as infant death in the first twenty-eight days, HIV, and homicide.

Access to Education
- New York City scores 5.45 on the Education Index. Although New York scores higher on the Education Index than the United States as a whole (5.45 compared to 5.17) due to higher levels of bachelor’s and graduate degree attainment, almost one in five adults in the city lacks a high school diploma.
- On average, women in New York City have higher educational attainment levels than men, with an Education Index score of 5.52, compared to 5.37.
- Education Index scores of US- and foreign-born New Yorkers are separated by nearly three points—6.44 compared to 3.54. Foreign-born New Yorkers are less likely to be enrolled in school and less likely to have attained a high school, bachelor’s, or graduate degree. Educational attainment and enrollment rates for immigrant New Yorkers vary considerably by race and ethnicity, however.
- White residents score the highest on the Education Index (7.67). Asians score second highest (5.76), but educational outcomes vary considerably by Asian subgroup. Black New Yorkers come in third (4.54) and Latino New Yorkers have the lowest score (3.24), though, again, educational attainment varies by subgroup.
- Education Index scores vary tremendously across New York City neighborhoods, ranging from Carnegie Hill on the Upper East Side, with a score of 9.50, to North Corona in Queens, which scores just 1.38.
- Low Education Index scores are associated with higher rates of poverty, child poverty, unemployment, incarceration, and births to teenagers. Higher education scores are associated with higher median personal earnings.

A Decent Standard of Living
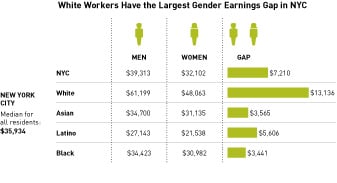
- NYC median personal earnings are $35,934, above the US median of $31,416.
- The typical white worker takes home $52,290, over $20,000 more than the typical Asian or black worker (with median earnings of $32,156 and $32,059, respectively) and twice the earnings of the typical Latino worker ($25,086).
- Men earn $7,000 more than women in NYC, despite women’s superior performance on the Education Index. The gender earnings gap is widest for white workers—white men typically earn $13,100 more than white women in the city. Black men and women have the smallest gender earnings gap, likely a sign of disproportionate discrimination faced by black men rather than an advantage for black women.
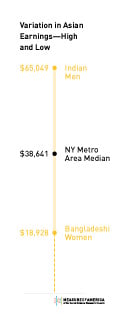
- US-born New Yorkers make $11,000 more than foreign-born New Yorkers. NYC Asians have the largest gap: Asians born in the United States earn over $18,000 more than those who immigrated.
- Earnings range from a median of $95,000 in Carnegie Hill on the Upper East Side to $14,400 in the Bronx neighborhood of Belmont.
- Over 50 percent of New Yorkers qualify as rent burdened (spending more than 30 percent of their incomes on rent and utilities), the third-highest rate of the ten most populous US metro areas.
- There is a strong negative relationship between incarceration rates and earnings in New York City neighborhoods.
CONCLUSION
The report concludes with an ambitious but realistic goal: to increase well-being for all city residents and narrow the gaps between groups, resulting in an increase in the HD Index— from today’s 5.98 to 6.60 by 2025.
To achieve this goal in a way that results in measurable well-being improvements for all, with a focus on the most vulnerable residents, the following areas are priorities:
HEALTH: Structuring neighborhood, school, and work environments such that the healthiest choices are also easy choices and addressing the particular health challenges of black New Yorkers will extend life expectancy for all and achieve significant gains for the group with the lowest life expectancy. Investing in the social determinants of health in black communities and reducing antiblack racism, which exacts a heavy toll on the health of black New Yorkers, are particularly important.
Target: Increase average life expectancy by one year, from 82.3 years to 83.3 years, by 2025.
EDUCATION: Better educational outcomes require that we address the social and economic disadvantages that threaten children’s stability, protect them from harm, and promote healthy cognitive development in the early years; improve school quality such that all children have good choices; and address the disproportionate rates of youth disconnection among black and Latino young people. A focus on Struggling NY and Precarious NY and on Latinos citywide will help narrow the gaps in educational attainment and quality.
Target: Increase enrollment by 6 percent and boost adult educational attainment by 6 percent by 2025.
EARNINGS: Increasing wages, addressing the affordable housing crisis, reducing the toll of justice involvement in high-incarceration neighborhoods, and reducing the gender earnings gap will lift median personal earnings, enabling greater economic security and a chance for all New Yorkers to invest in themselves and provide a safe, stable environment for the next generation. This will require a laser focus on workers whose median personal earnings are very low, namely those in Precarious NY (under $22,000 annual median personal earnings) and Struggling NY (under $29,000).
Target: Increase median earnings by $4,000 by 2025 (in inflation-adjusted dollars).
Who Graduates?
New Findings on NYC High School Admissions and Graduation Rates
LAUNCHED MAY 5, 2017
FULL REPORT | INTERACTIVE TOOL | MEDIA RELEASE
 Beginning in 2016, Measure of America worked with the New York Times for nearly a year to develop a custom dataset that analyzes NYC high school graduation rates in a way that hasn’t been done before. Our original research informed a feature story that asked and answered important questions about school choice and how to ensure every student has access to the best education the city has to offer.
The on-time high school graduation rate for New York City public school students has risen every year for over a decade, a significant accomplishment of which the city should be proud. Yet startlingly wide graduation rate gaps exist between different groups of students. Virtually every ninth grader who entered high school in 2011 on the basis of a successful Specialized High School Admissions Test (SHSAT) graduated four years later; in contrast, fewer than six in ten students admitted to educational option programs graduated on time in 2015. To address these disparities, it’s essential to look beyond the marquee numbers to determine which students are graduating on time, which aren’t, and what can be done about it.
“Who Graduates?” uses a new dataset obtained by special agreement from the NYC Department of Education to look at high school graduation through the lens of types of high school programs students are admitted to.
The mandatory high school choice system is a complex, high-stakes process that roughly 80,000 New York City eighth graders must navigate every year in order to gain admission to high school. It requires all eighth-graders to rank their top 12 high school program preferences from over 700 programs in 400-plus public high schools. No neighborhood “default” option exists. Each program uses one of six admissions methods, which vary sharply in terms of competitiveness. This lens is critical because the high school choice process is hugely consequential for children and families. The report concludes that ensuring that our most able students get a good education, worthy goal that it is, is not enough. Average and struggling students also have the right to a high quality education; indeed, it’s in all of our interests to make sure they get it.

Key Findings:
- A striking 97.4 percent of students admitted to high school based on the SHSAT graduated on time in 2015, compared to only 59.8 percent of those admitted to educational option programs and 68.1 percent of those admitted to limited unscreened programs. Educational option programs and limited unscreened programs together educate nearly 35,000 city teenagers.
- Overall, 16.6 percent of Asian American students were admitted to specialized high schools; only 1.1 percent of black students and 1.1 percent of Latino students were. Well over half of all black and Latino students were admitted to either an educational option or a limited unscreened program, compared to roughly one in five white or Asian students.
- Citywide, Asian Americans had the highest graduation rate (85.4 percent) and Latinos had the lowest (64.4 percent). But the largest gap by race and ethnicity was in the graduation rates of Native American (52.1 percent) and Asian American (81.6 percent) students assigned to educational options programs.
- Graduation rates varied by borough. The graduation rate gap between those students who lived in the borough with the highest (Queens, 77.3 percent) and lowest (Bronx, 63.7 percent) graduation rates was 13.6 percentage points. The distance between the highs and lows widened when we added the type of program, ranging from just 3.1 percentage points between Manhattan and Staten Island students admitted to specialized high schools to a 28.9-point difference for zoned programs between students living in the Bronx (47.2 percent) and students living in Staten Island (76.2 percent).
- The gap between the NYC community districts whose students were most likely to graduate, Bayside, Douglaston & Little Neck (92.3 percent), and least-likely to graduate, Hunts Point & Longwood (59.2 percent), was 33.1 percentage points.
- Our analysis shows clearly that certain groups of students are at high risk for not graduating in four years. Fewer than seven in ten black, Latino, or Native American students; students admitted to high school through the educational option and limited unscreened methods; students who lived in the Bronx and Manhattan overall; and students living in twenty-three community districts graduated on time in 2015.
In addition, the following groups are at still higher risk of not graduating on time:

Recommendations:
This analysis suggests that the city should look closely at educational option programs; four in ten students admitted to these programs don’t graduate on time. The philosophy behind the educational option approach is that bringing young people of different academic abilities together to learn produces better results, and ample evidence supports this view. In practice, however, too few top-performers choose educational option programs for these programs to work as they were designed to. SHSAT and screened programs skim off the the lion’s share of high-achievers, leaving comparatively few to fill spots in the educational option programs. The city should also target more support to black and Latino students who attend both zoned and educational option programs, whose graduation rates are below 60 percent.
The school system cannot be expected to provide this support on its own; other city agencies, nonprofits, foundations, and businesses have important roles to play in addressing the myriad inequalities NYC families and neighborhoods face. A strong, safe, dynamic NYC depends on everyone having the skills they need to live productive, rewarding, freely chosen lives. Ensuring that more of our young people get their diplomas is good for all of us.
__________________________________________________________________________
For media and all other inquiries, contact us at: contact@measureofamerica.org | (718) 517-3720.
High School Graduation in New York City
LAUNCHED MAY 11, 2016
FULL REPORT | INTERACTIVE TOOL | MEDIA RELEASE
 High School Graduation in New York City: Is Neighborhood Still Destiny? is an in-depth look at disparities in on-time high school graduation rates by New York City neighborhood.
High School Graduation in New York City contributes to the ongoing discussion around high school quality, outcomes, and choice in the City by presenting the on-time graduation rates for high school students not by the schools they attend, since those data are already available, but rather by the neighborhoods they call home.
The findings in this DATA2GO.NYC report raise important questions: How successful is the universal high school choice policy in weakening the well-known link between the conditions in students neighborhoods and their educational outcomes? Do the benefits of the current system outweigh its costs to students and families? How might it work better?
KEY FINDINGS
- More than 95 percent of students in Manhattan Community Districts 1 and 2, which include Battery Park City, Greenwich Village and Soho, graduate within four years, compared with just 61 percent of students in Bronx District 5, which includes Morris Heights, Fordham South and Mount Hope. Disparities in New York City high school graduation rates by neighborhood dwarf those by race, ethnicity, and gender.
- Neighborhood disadvantage and the likelihood of not graduating high school in four years are strongly linked. The higher the child poverty rate in a community district, the less likely a young person living in that district will graduate high school on time.
- The higher the median household income in a district, the higher the graduation rate of students who live there.
[layerslider id=”HSGNYC”]
RECOMMENDATIONS
-
A yawning chasm separates the on-time graduation rates of young people living in the City’s affluent, largely white neighborhoods and those who call low-income, black and Latino communities home. The City should set an ambitious, timebound target for slashing the neighborhood graduation gap and make the changes needed to get there.
- The city’s school choice program does provide benefits to some children. But it assumes all kids have adults in their lives with the time, language skills, social networks, and financial resources needed to help them through this bewildering process. Our analysis suggests this is not the case. As a start, middle schools need more guidance counselors with fewer student caseloads. And students need more good high school options to choose from.
- But in the longer term, this new analysis shows that we cannot expect the high school choice policy alone to overcome disadvantages years in the making. Real educational equality requires investments in children, families, and communities far earlier. For this, the city must address factors like economic insecurity, lack of safe, affordable housing, and the food insecurity and health challenges that high school students bring with them every morning they leave their home neighborhoods to travel to high school somewhere else.
DATA2GO.NYC
![]()
A new way to measure what matters for well-being and opportunity in New York City, DATA2GO.NYC brings together federal, state, and city data for the first time at the neighborhood level. It’s free, easy to use, and will be maintained for years. The groundbreaking online tool that allows users to visualize where people in need are, what resources are available to assist them, where gaps exist, and how different factors interact to shape the choices and opportunities available to them.