A Portrait of California 2021–2022
LAUNCHED NOVEMBER 10, 2021
Regional Report Series: Inland Empire | Sonoma County | San Joaquin Valley | Del Norte County | Mendocino County | Rural California
 A Portrait of California 2021–2022: Human Development and Housing Justice, the third volume in Measure of America’s Portrait of California series, takes a human development approach to understanding the country’s most populous and diverse state. Using the American Human Development Index (HDI), it presents a detailed picture of how Californians are doing on three key dimensions of well-being—a long and healthy life, access to knowledge, and a decent standard of living. In addition to an in-depth survey of well-being levels across the state, this volume in the Portrait of California series focuses on a central prerequisite to a good life, one that far too many Californians struggle to attain: access to safe and secure housing. The Covid-19 pandemic dramatically underscored the importance of stable, affordable housing when it comes to access to education, living standards, and health. A Portrait of California 2021–2022: Human Development and Housing Justice explores the impact of California’s housing crisis on all three components of the index and outlines policies that can help the state address homelessness and housing insecurity to ensure that all Californians have a safe place to call home.
This report presents HDI scores for the state overall as well as by gender, by race and ethnicity, by nativity, by metro area, and by neighborhood cluster. In addition to providing HDI scores for various groups and geographies, it also delves deeper into the underlying causes of the gaps in well-being between them—structural racism, discrimination, sky-high housing costs, among others—and offers recommendations for addressing these challenges and building a fairer future for the Golden State, one in which every Californian can lead a freely chosen life of value.
KEY FINDINGS
AMERICAN HUMAN DEVELOPMENT INDEX
- California scores 5.85 out of 10 on the American Human Development Index, with gains in all three components of the HDI since 2009. California’s HDI score is higher than the country’s as a whole and has improved at a faster rate.
- Looking at scores by race and ethnicity, however, reveals that of the state’s six major racial and ethnic groups, only two—Latino and Asian Californians—have seen improvement in overall well-being. Latino Californians experienced the greatest increase on the HDI of any racial or ethnic group, from 3.99 in Portrait of California 2011 to 4.81 now. The scores for white, Black, and Native American Californians declined between 2009 and 2019. Since 2000, the HDI score for Native American Californians has declined by an alarming 22.5 percent, the sharpest drop experienced by any group. This is the first year for which we have an HDI score for Native Hawaiian and Other Pacific Islander (NHOPI) Californians, 4.20.
- Overall, women in California score slightly higher than men, 5.81 compared to 5.73, faring better on the health and education components of the index. Black, Latina, Native American, and NHOPI women all score higher than their male counterparts, while white and Asian women score lower due to the especially large gender earnings gaps within these groups.
- Greater San Jose scores the highest on the HDI of California’s metro areas, 8.09, while Madera scores the lowest. Greater Los Angeles contains the widest well-being range in the state.

FIVE CALIFORNIAS
While comparing the highest- and lowest-scoring areas is useful for understanding California’s human development extremes, most places fall somewhere along the vast well-being continuum present in the state. In order to make sense of California’s 265 neighborhood clusters and to highlight commonalities shared by different places, this report sorts areas with similar HDI scores into five groups:
- One Percent California comprises six neighborhood clusters with scores of 9.00 or higher on the HDI, five of which are located in the Bay Area. The 900,000, people, 2.3 percent of the state population, living in these communities enjoy higher levels of well-being and greater access to opportunity than almost anyone in the country.
- Elite Enclave California is home to roughly eight million people, or one-fifth of the state’s population. Its fifty-six neighborhood clusters, scoring between 7.00 and 8.99 on the index, are found almost entirely in the Bay Area, Los Angeles, and San Diego.
- Main Street California neighborhood clusters score between 5.00 and 6.99 on the HDI. More than eighteen million people, 46 percent of the population, live in one of these 121 areas. Main Street Californians have higher levels of wellbeing than the average US resident. Nonetheless, California’s high cost of living means that some Main Streeters face levels of economic insecurity similar to that of Struggling California.
- Struggling California is made up of eighty-two neighborhood clusters with index scores between 3.00 and 4.99, found chiefly in greater Los Angeles, the Inland Empire, the Central Valley, greater San Diego, and northern California. Its residents, who make up roughly 30 percent of the state’s population, have lower levels of well-being than the typical American.
- Disenfranchised California comprises areas that score below 3.00 on the HDI. Today, none of the state’s 265 neighborhood and town clusters meet this criteria, compared to nine in A Portrait of California 2014–2015 and eleven in the 2011 volume.
A LONG AND HEALTHY LIFE
- The health component of the index is measured by life expectancy at birth. A baby born in California today can expect to live 81.0 years on average, compared to 78.8 years in the US overall. Since 2012, life expectancy in California—and in the country as a whole—has dropped by 0.2 years.
- Of the state’s major racial and ethnic groups, Native American Californians have the shortest life expectancy, 71.2 years, and have experienced the greatest loss in life expectancy since 2012, a decrease of over 8 years. Asian Californians live the longest, on average, 87.0 years, although life expectancies vary significantly among Asian subgroups. Black Californians’ life expectancy (74.1 years) decreased by a concerning 1.5 years between 2012 and 2019, and has no doubt fallen further due to the pandemic.
- Over 12 years separate the life expectancies of the longest- and shortest-living neighborhood clusters, Milpitas & Northeast San Jose (87.3 years) and West San Bernardino (75.0 years). The neighborhood clusters with the longest average life expectancies have a relatively higher proportion of Asian residents, while neighborhoods at the bottom of the list tend to have a relatively higher proportion of Black or Latino residents, highlighting the negative impact of residential segregation on health outcomes.
 ACCESS TO EDUCATION
- California is ahead of the United States overall on the education dimension of the index, measured by a combination of degree attainment and school enrollment indicators. Compared to the US as a whole, California has slightly higher bachelor’s and graduate degree attainment rates, but the share of adults age 25 and older without a high school degree in California, 15.9 percent, is higher than the national rate, 11.4 percent.
- While California fares better overall on the education component of the index than the country as a whole, gaps between racial and ethnic groups persist. Even where the Latino Education Index score is the highest—the rural Humboldt County area—Latinos score more than one point below the average Californian and well below the local white population.
- Education and income are closely linked in California. The highest-educated neighborhood clusters are concentrated in the affluent neighborhoods and suburbs of three major metropolitan areas, the Bay Area, Los Angeles, and San Diego. Conversely, the neighborhoods with the lowest Education Index scores—concentrated in urban city centers in Los Angeles as well as in both urban and rural communities in the Central Valley and the Inland Empire—are among the lowest-earning in the state.
- California’s youth disconnection rate—the share of teens and young adults who are neither working nor in school—is 10.3 percent and declined each year for the past decade. Unfortunately, we anticipate that data from 2020 and 2021 will show pandemic-induced spikes in the youth disconnection rate. Wide disparities between different geographies and groups persist: Asian and white young people have the lowest disconnection rates, 6.0 percent and 8.9 percent, respectively, while Black and Native American youth have the highest, 18.4 percent and 23.2 percent.

 A DECENT STANDARD OF LIVING
- The standard of living dimension of the index is measured by median personal earnings. In California, the typical worker takes home $39,500 annually, $3,000 more than the US median. White workers earn the most ($51,700), followed by Asian workers ($51,100), NHOPI workers ($38,200), Black workers ($36,400), Native American workers ($32,400), and Latino workers ($30,200).
- Earnings gaps are even more striking when gender is taken into account: at the high end of the earnings scale, white men take home $61,600 each year, while Latina women, the lowest-paid group in the state, earn just $25,100. Although the size of the gaps varies, women earn less than men in each major racial and ethnic group, and the Covid-19 pandemic threatens to set women—especially women of color—even further back.

- In each of California’s metro areas, white workers earn more than the state median, while Latino workers earn less. The Latino-white pay gap is widest in San Jose, where Latinos earn $0.46 for every dollar earned by white workers.
- A difference of nearly $100,000 separates California’s highest- and lowest-earning neighborhood clusters: earnings range from $22,100 in Los Angeles’ East Vernon neighborhood to $120,400 in Cupertino, Saratoga & Los Gatos in Santa Clara County.
Geographies of Opportunity
LAUNCHED APRIL 22, 2015
FULL REPORT | MAP THE DATA | MEDIA RELEASE
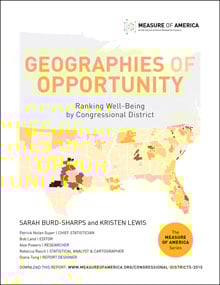 Geographies of Opportunity: Ranking Well-Being by Congressional District is an in-depth look at how residents of America’s 436 congressional districts are faring in three fundamental areas of life: health, access to knowledge, and living standards. While these metrics do not measure every aspect of our multifaceted society, they capture outcomes that are essential to well-being and opportunity. The hallmark of this work is the American Human Development Index, a supplement to GDP and other money metrics that tells the story of how ordinary Americans are faring. For more on the index, go here.
KEY FINDINGS: AMERICAN HUMAN DEVELOPMENT INDEX
- The top ten congressional districts in terms of human development (HD) are all in the greater metropolitan areas of LA, NYC, San Francisco, and DC.
- The bottom ten districts disproportionately comprise struggling rural and urban areas in the South. These areas face interlocking challenges in terms of residential segregation by income and race, poor health, under-resourced educational infrastructure, and limited job opportunities.
- In the 22 congressional districts where almost all residents (98 percent or more) are native-born, American Human Development Index scores are all below the national average.
[layerslider id=”8″]
KEY FINDINGS: HEALTH
- Life expectancy ranges from just under 84 years in California District 19 (San Jose and part of Santa Clara County) to just under 73 years in Kentucky District 5 (rural southeastern Kentucky). This shocking gap is more extreme than the life expectancy difference between Japan and the Palestinian territories.
- African Americans fare particularly poorly on health indicators. Whites outlive African Americans by 3.6 years; African Americans have higher death rates from a variety of causes, chief among them heart disease, cancer, homicide, diabetes, and infant death.
- The higher the proportion of foreign-born residents in a congressional district, the longer the district’s life expectancy.
KEY FINDINGS: EDUCATION
- Topping the charts in education are districts from the San Francisco, Boston, New York, Los Angeles, and Washington, DC, metro areas. They occupy this rarefied position for two primary reasons: these cities attract highly educated workers from elsewhere and support (with some notable exceptions) their youth with robust pathways to high school and college completion.
- There are over 5.5 million disconnected youth in the United States—young people between the ages of 16 and 24 who are out of work and out of school. In 32 districts, at least one in every five youth are disconnected. These districts are concentrated in the South and Southwest.
KEY FINDINGS: STANDARD OF LIVING
- Median personal earnings by congressional district range from about $20,000 in the highly diverse LA neighborhoods of California District 34 to more than triple that sum (nearly $61,000) in New York District 12 (Manhattan’s East Side and parts of Brooklyn and Queens). The distribution of earnings between these two extremes is heavily skewed toward the lower end; in over half of all districts (222 out of 436), median personal earnings fall between $20,000 and $30,000.
- Pockets of high and low earnings are found in every part of the country. The greatest earnings inequality is in the Middle Atlantic region—home to both the storied glamor of the top-earning Upper East Side of Manhattan and, just five subway stops away, the entrenched poverty of the South Bronx neighborhoods that make up District 15, which has the fourth-lowest earnings in the nations.
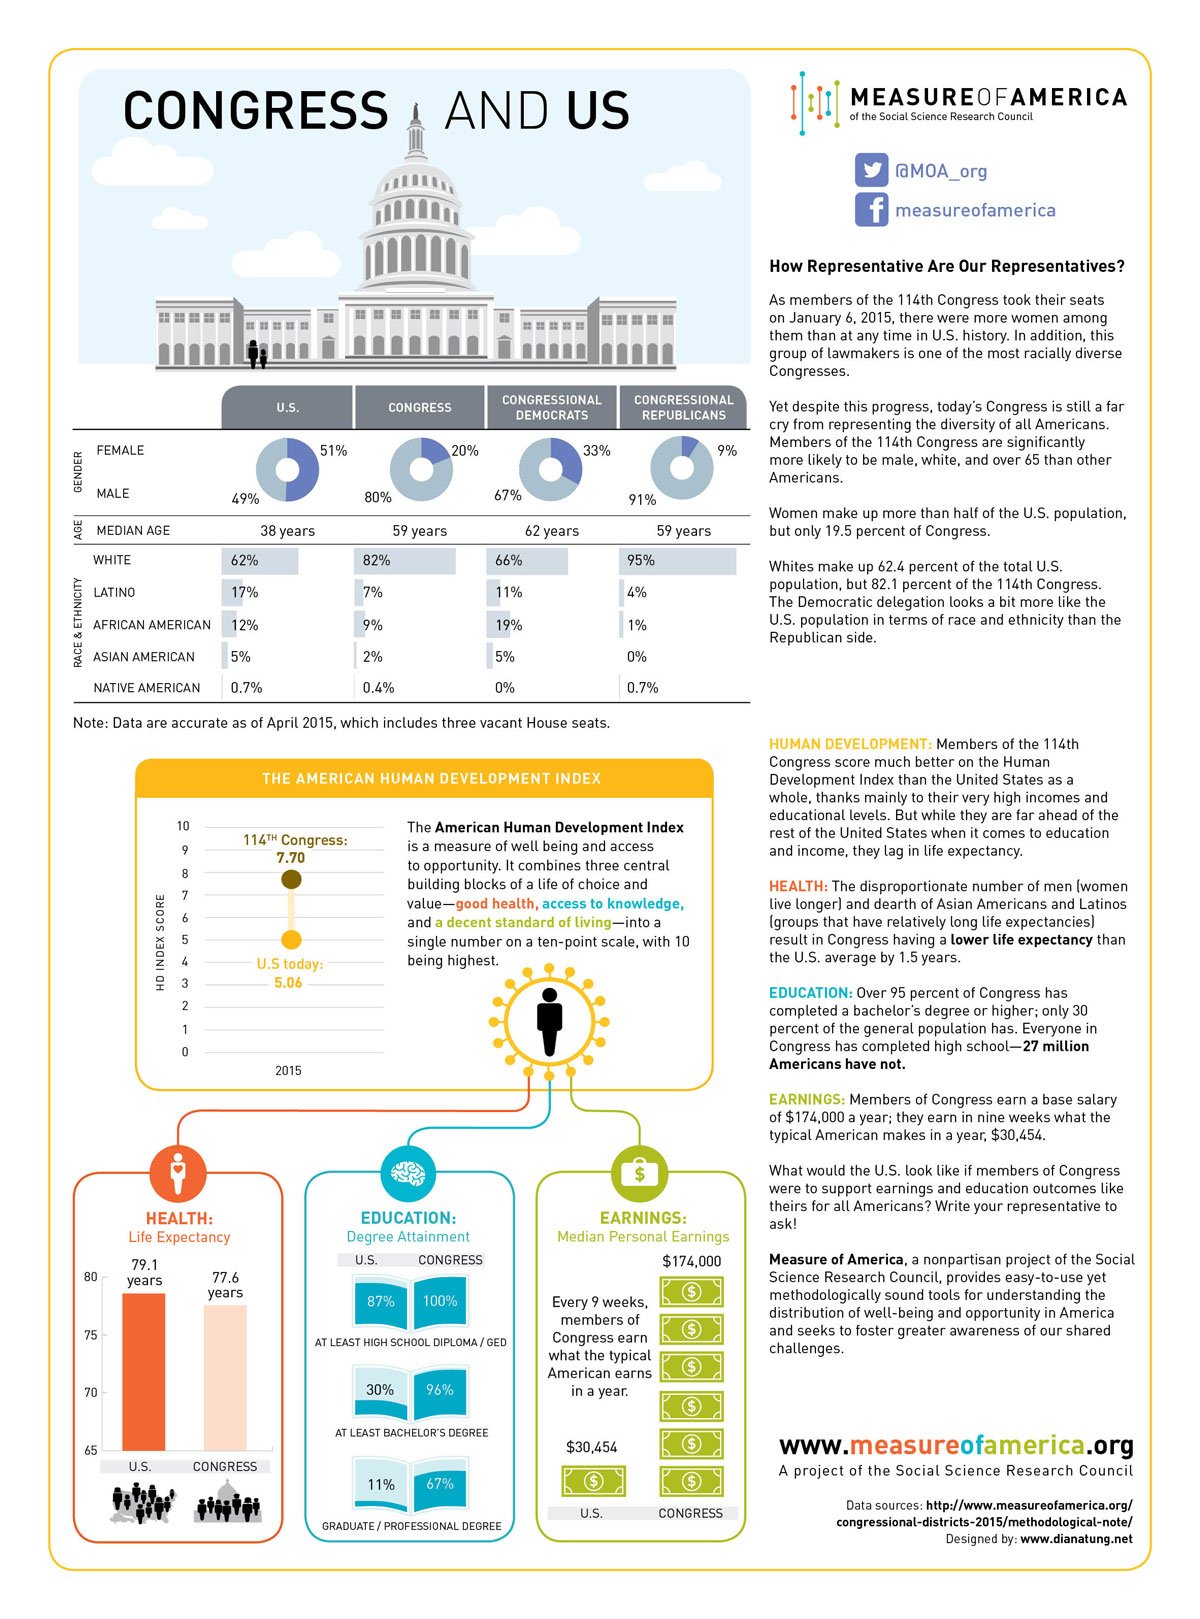
Members of Congress as a group tend to have much higher levels of human development than the people they represent. The graphic below shows how the 114th Congress compares to the U.S. population on the American Human Development Index.
A Portrait of California 2014–2015
LAUNCHED TUESDAY, DECEMBER 9, 2014
FULL REPORT | MEDIA RELEASE | INTERACTIVE MAP | DOWNLOAD DATA TABLES
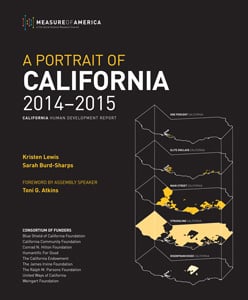 If California were a country, it would rank 34th in the world by population and 8th by the size of its economy—big enough for a seat at the G8. But that’s not the whole story. Instead of relying only on economic analysis, Measure of America’s A Portrait of California uses the human development approach to tell us how people are doing. Three dimensions—a long and healthy life, access to knowledge, and a decent standard of living—are examined in detail and presented along a simple ten-point scale: the American Human Development (HD) Index.
Toni Atkins, the Speaker of the California State Assembly, wrote the report’s foreword, stating: “This fact-based exploration of how children and their communities across California are doing is a must-read for policymakers, business leaders, philanthropists, and anyone who cares about our future…I urge my colleagues, and everyone concerned with California’s future, to use this report to inform our work in the coming years.”
KEY FINDINGS
Income inequality is in the headlines these days, and attention to this huge and growing problem is welcome. But to focus on inequality in income alone is to take a narrow view of the problem and what’s at stake. Mutually reinforcing inequalities in health, education, environment, neighborhood conditions, wealth, and political power have created an opportunity divide that higher wages alone cannot bridge. [layerslider id=”7″]
This 2014–2015 update of the 2011 California report allows us to compare
outcomes from one place to another and to look at changes over time. The result is a comprehensive reference tool and a critical starting point for informed discussions on policy solutions.
FIVE CALIFORNIAS
Inequalities in health, education, and earnings divide California communities in ways that challenge conventional north-south and inland-coastal divisions in the state. By using the HD Index score to sort county, town, and neighborhood clusters,we have identified “Five Californias,” each with its own distinct well-being profile.
- One Percent California consists of the two neighborhood clusters that score 9 or above out of 10 on the HD Index; these neighborhoods are home to just under one in every one hundred Californians.
- Elite Enclave California is made up of neighborhood clusters that score between 7 and 8.99 on the Index; 15 percent of Californians are part of this group.
- Main Street California comprises neighborhood clusters that score between 5 and 6.99 and is home to 39 percent of Californians.
- Struggling California is home to the largest share of the state’s population, 42 percent, with these neighborhood clusters scoring between 3 and 4.99 on the Index.
- Disenfranchised California comprises neighborhood clusters that score below 3 on the HD Index; this California is home to roughly 3 percent of the state’s population.
The Five Californias also gives us a window into California’s future. The HD Index numbers make plain the need to address the future of the state in two ways: by preventing problems from taking root in childhood and by helping parents. Together, Struggling and Disenfranchised California are home to almost half the state’s population and to more than half (50.9 percent) of the state’s children. In Struggling California, nearly one in five teens and young adults fall into the “disconnected youth” category, or youth ages 16 to 24 who are neither working nor in school.
A PORTRAIT OF CALIFORNIA: OVERALL
- Though California made substantial human development progress from 2000 to 2005, the state has been treading water in terms of well-being since 2005; the HD Index score was 5.39 on this ten-point scale in 2005 and again in 2012.
- The state’s HD Index score exceeds the national average (5.07), but scores by county, metro area, and neighborhood cluster reveal large variations in fundamental health, education, and earnings outcomes within the state. The greatest geographical variations are often found within, rather than between, counties and metro areas.
- Of the state’s ten largest metro areas, San Jose tops the well-being chart, with an HD Index score of 7.08, higher than the top-ranking state, Connecticut. At the other end of the rankings table is Bakersfield, with an Index score of 3.69, lower than the worst-performing state, Mississippi. Fresno ranks ninth, with an Index score of 3.96—on par with well-being levels in West Virginia.
HEALTH
- Health is a good news story from 2000 to 2012: life expectancy at birth in California increased by 2.7 years to 81.2 years. Californians live longer than the average American, ranking fourth among states on this fundamental indicator.
- But at the neighborhood level, the story changes. Nearly a dozen years separate the top and bottom neighborhood clusters in California, from a life expectancy of 87.0 years in parts of northwest Santa Clara to 75.3 years in Twenty-Nine Palms City and Barstow City in San Bernardino County.
- By race and ethnicity, Latinos outlive whites in California by 3.6 years. African American men have the lowest life expectancy of all race, ethnicity, and gender categories, 72.8 years, just under the male life expectancies of Tunisia and Vietnam. This is in part the result of tragically high premature death rates among men due to heart disease, homicide, and cancer.
EDUCATION
- More education is associated with a range of positive outcomes that extend well beyond better jobs and bigger paychecks. Measure of America’s research suggests, for example, that if every Californian adult were to magically “move up” just one education level, nearly 1 million fewer Californians would live in poverty, life expectancy would increase by 1.6 years, 1,200 fewer Californians would be murdered each year, and 2.4 million more Californians would vote in elections.
- Change in educational attainment since 2000 has been very positive. A higher percentage of Californian adults 25 years and older hold bachelor’s and graduate degrees than they did in 2000, and the share of adults who lack a high school diploma fell from 23.2 percent in 2000 to 18.5 percent in 2012—though that rate is still about 5 percentage points higher than the national average.
- Latinos have the lowest educational attainment score, lagging in school enrollment for those ages 3 to 24 as well as in the proportion of adults who have completed high school, a bachelor’s, and a graduate degree. However, U.S.-born Latino adults are slightly more likely than the average Californian to have graduated high school, a trend that bodes well for Latino educational levels in the next generation.
- The youth disconnection rate (the share of young people ages 16 to 24 who are neither working nor in school) is cause for concern. In the ten most populous California metro areas, the rate ranges from a low of 10.4 percent in Oxnard–Thousand Oaks to more than double that, 24.2 percent, in Bakersfield. More striking still is the youth disconnection range within large metro areas by race and ethnicity.
EARNINGS
- What has stymied overall human development progress in recent years? The culprit is the decline in earnings. California’s median earnings in 2005, $33,305, were 16 percent higher than they were in 2012. Median earnings are the wages and salaries of the typical worker.
- California’s agriculture feeds the nation, but the state’s crop workers struggle to buy groceries, with annual earnings that range from $15,000 to $17,500.
- Median earnings by metro area range from San Jose, at over $42,000 to Fresno, with earnings of under $23,000, slightly more than half what the typical San Jose worker is earning.
- White men outearn white women by almost $18,000. The gender pay gap for the state’s other major racial and ethnic groups ranges from about $4,000 between Native American men and women to a gap of about $10,000 among Asian Americans. Wage inequality is not just a women’s issue; most California families depend on women’s earnings to make ends meet.
________________________________________________________
For media and all other inquiries, contact us at: contact@measureofamerica.org | (718) 517-3720.
A Portrait of California 2011
 A Portrait of California goes beyond the state’s fiscal and budgetary woes to examine the well-being of its people using the American Human Development Index, a measure based on official government data in health, education, and living standards. This timely report introduces the ‘Five Californias’ to highlight the varied opportunities open to differing segments of the population, and provides close-up snapshots of major metro areas. The report also ranks native-born and foreign-born residents for each major ethnic group, as well as all 233 Census neighborhoods in the state.
Read the Media Release | Comunicado de prensa
Create Maps for over 100 indicators
Conclusion
Download Data Set
Donors and Advisory Panel