Well-Being in Rural California
WELL-BEING IN RURAL CALIFORNIA 2023
RELEASED JUNE 29, 2023
FULL REPORT | LAUNCH SLIDES | LAUNCH WEBINAR | DOWNLOAD DATA
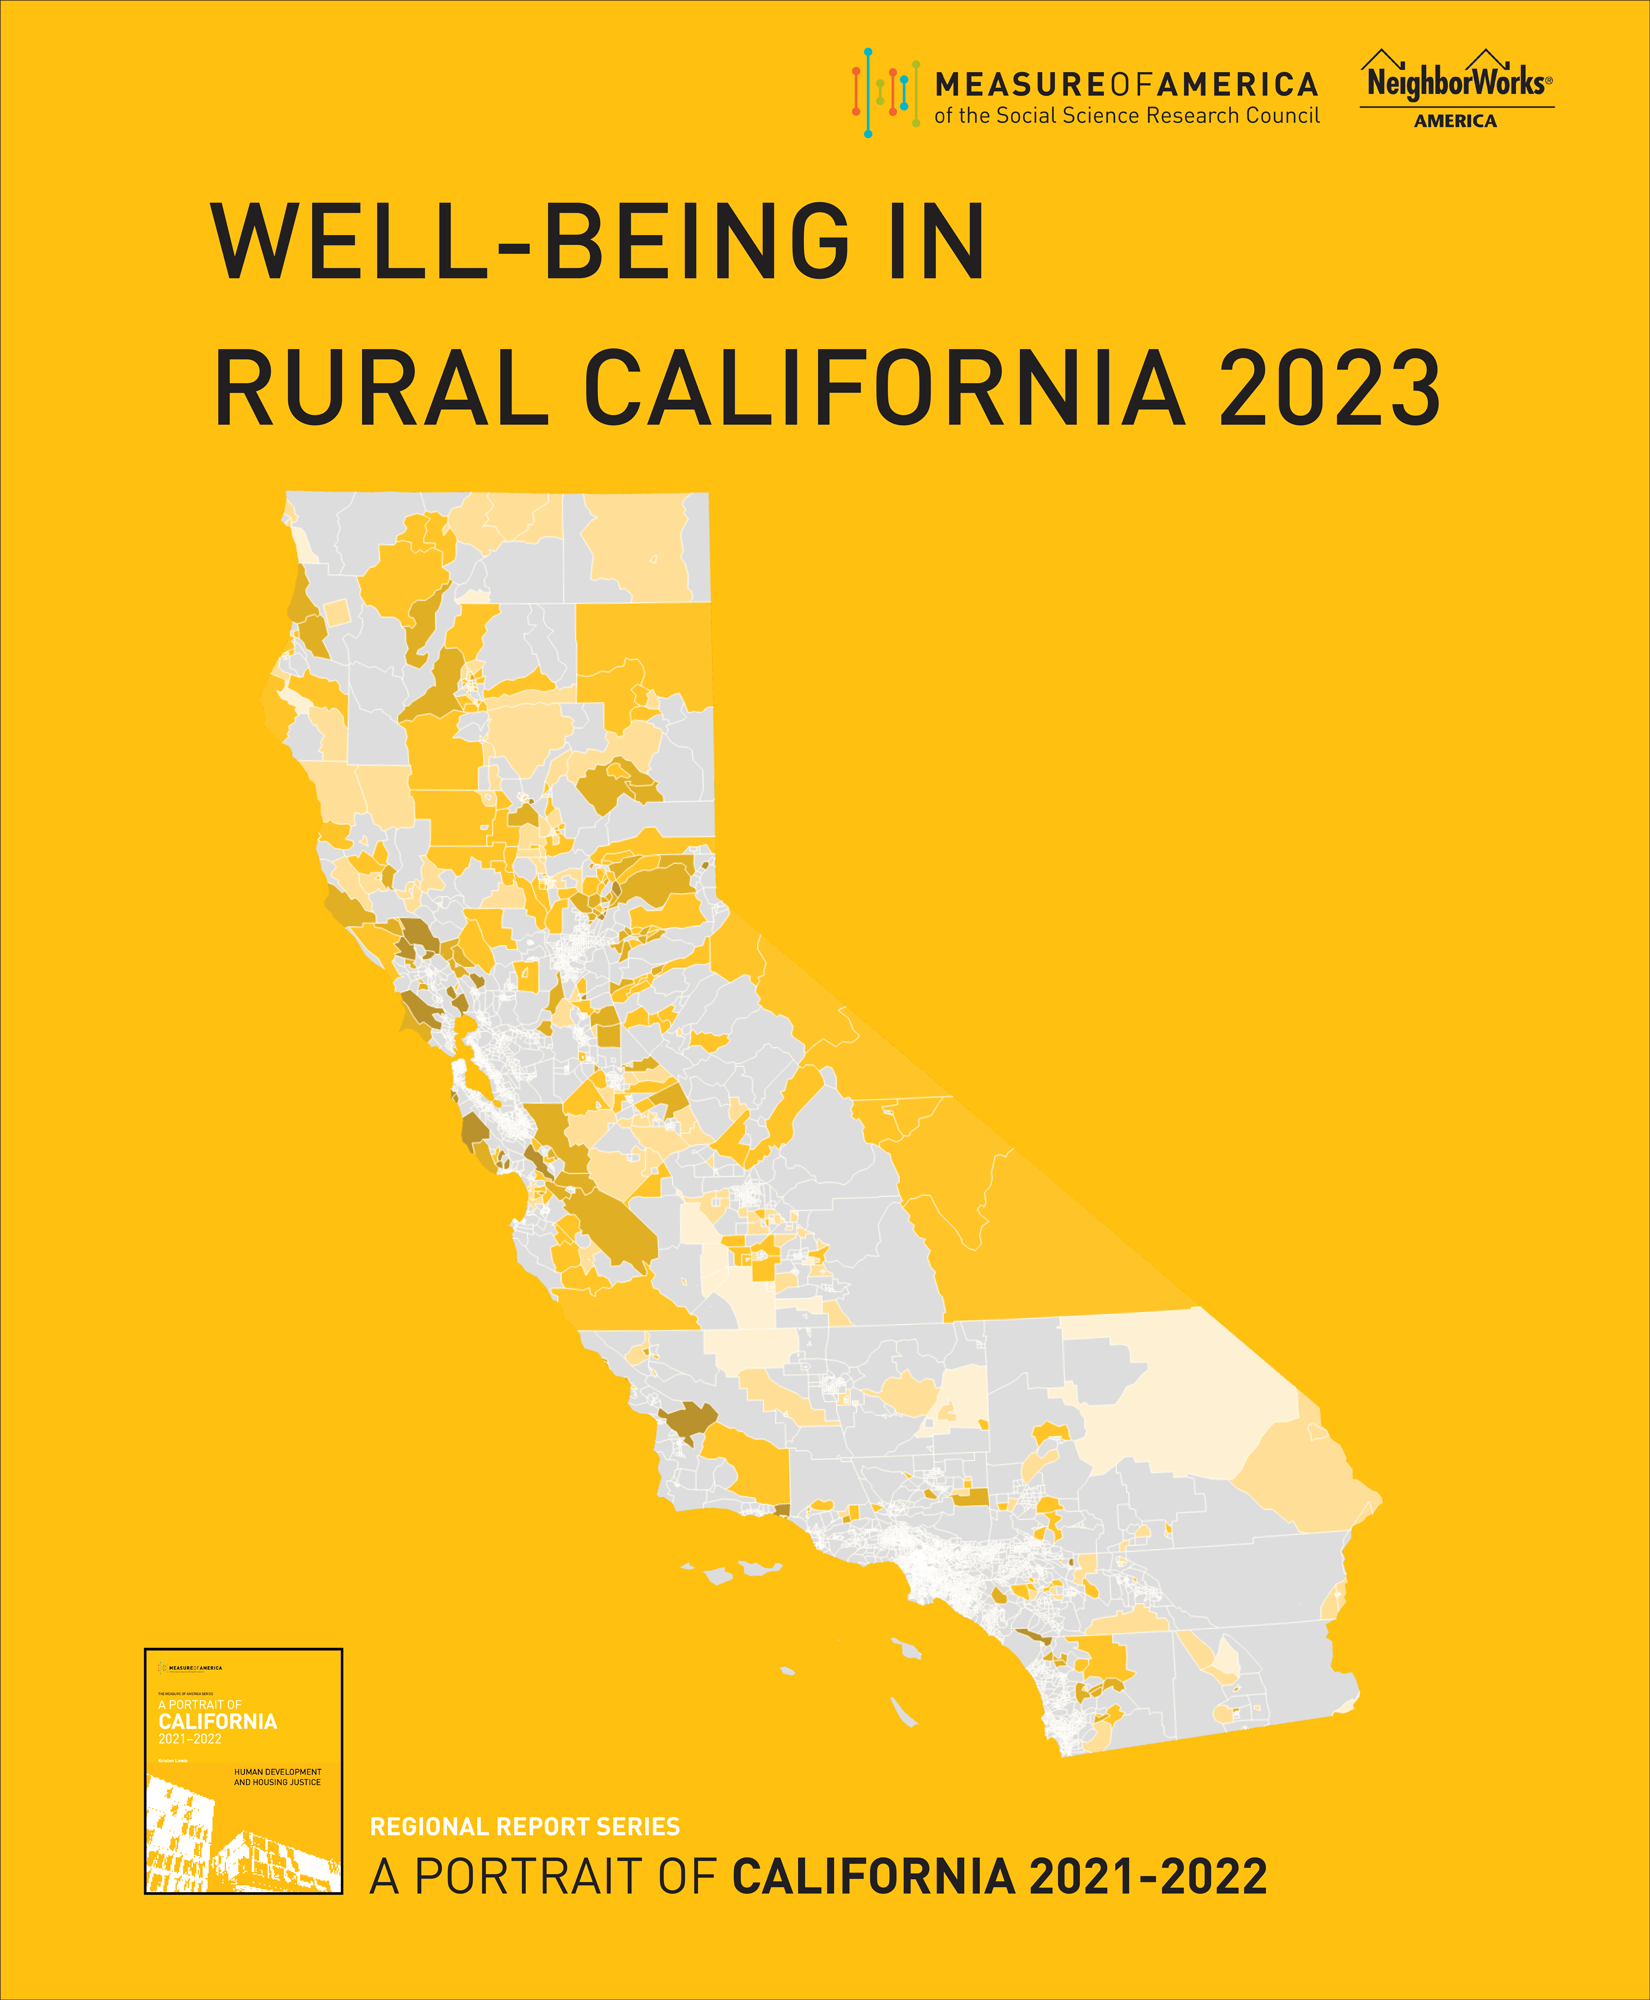 Well-Being in Rural California 2023 paints a picture of well-being and access to opportunity across race, place, and gender in rural California today. Using the American Human Development Index (HDI), this report presents how residents in rural California are doing on three key dimensions of well-being—a long and healthy life, access to knowledge, and a decent standard of living. Broken down by race and ethnicity, by gender, and by census tract, the index shows how communities are faring relative to one another and to the state and country as a whole. The report found that stark variation exists by place and by demographic group—resulting in significant inequalities across rural areas.
Well-Being in Rural California is part of a larger project, A Portrait of California 2021–2022, which explores well-being in the state as a whole, with a special focus on housing.
The HDI is expressed on a scale from zero to ten, with ten indicating higher levels of well-being across health, education, and standard of living. Rural California as a whole scores 4.84, falling significantly below the California statewide score of 5.85. Of the two racial and ethnic groups for whom it is possible to calculate HDI scores, white residents score 5.45 and Latino residents score 3.89.
Among census tracts in rural California, HDI scores range from a low of 1.79 in Census Tract 83.01 in Fresno County to a high of 8.47 in Census Tract 6136 in San Mateo County. Most higher-scoring rural tracts can be found in the mid-coast to northern region of the state; they tend to be predominantly white and affluent. The lower-scoring tracts are predominantly inland; seven of the lowest-scoring tracts lie in the Central Valley and three lie in California’s far north.
SELECT FINDINGS:
HEALTH:
- The average life expectancy in rural California is 79.8 years, compared to 81.1 years in the state as a whole. A baby girl born today in rural California can expect to live 82.3 years, a baby boy, 77.5 years—a 4.8-year difference.
EDUCATION:
- A slightly higher share of rural adults ages 25 and older have not completed high school (17.4 percent) compared to state residents overall (15.8 percent). Similarly, two and a half percentage points separate rural California from the state in terms of school enrollment—76.0 percent versus 78.5 percent.
- The difference is much greater when it comes to postsecondary degree attainment: compared to state residents overall, significantly smaller shares of rural Californians have bachelor’s degrees (22.9 percent versus 35.2 percent) or graduate degrees (7.8 percent versus 13.3 percent).
LIVING STANDARDS:
- Median personal earnings in rural California are $33,900, about $8,000 less than in the state overall. Men outearn women by a large margin, $40,100 versus $28,000, a difference of $12,100. Though the sizes of the earnings gaps vary by race and ethnicity, women across rural California earn much less than men, a phenomenon also found in California and in the country as a whole.
Spotlight on Del Norte County
SPOLIGHT ON DEL NORTE COUNTY
RELEASED JANUARY 16, 2023
FULL REPORT | LAUNCH SLIDES | LAUNCH WEBINAR | DOWNLOAD DATA
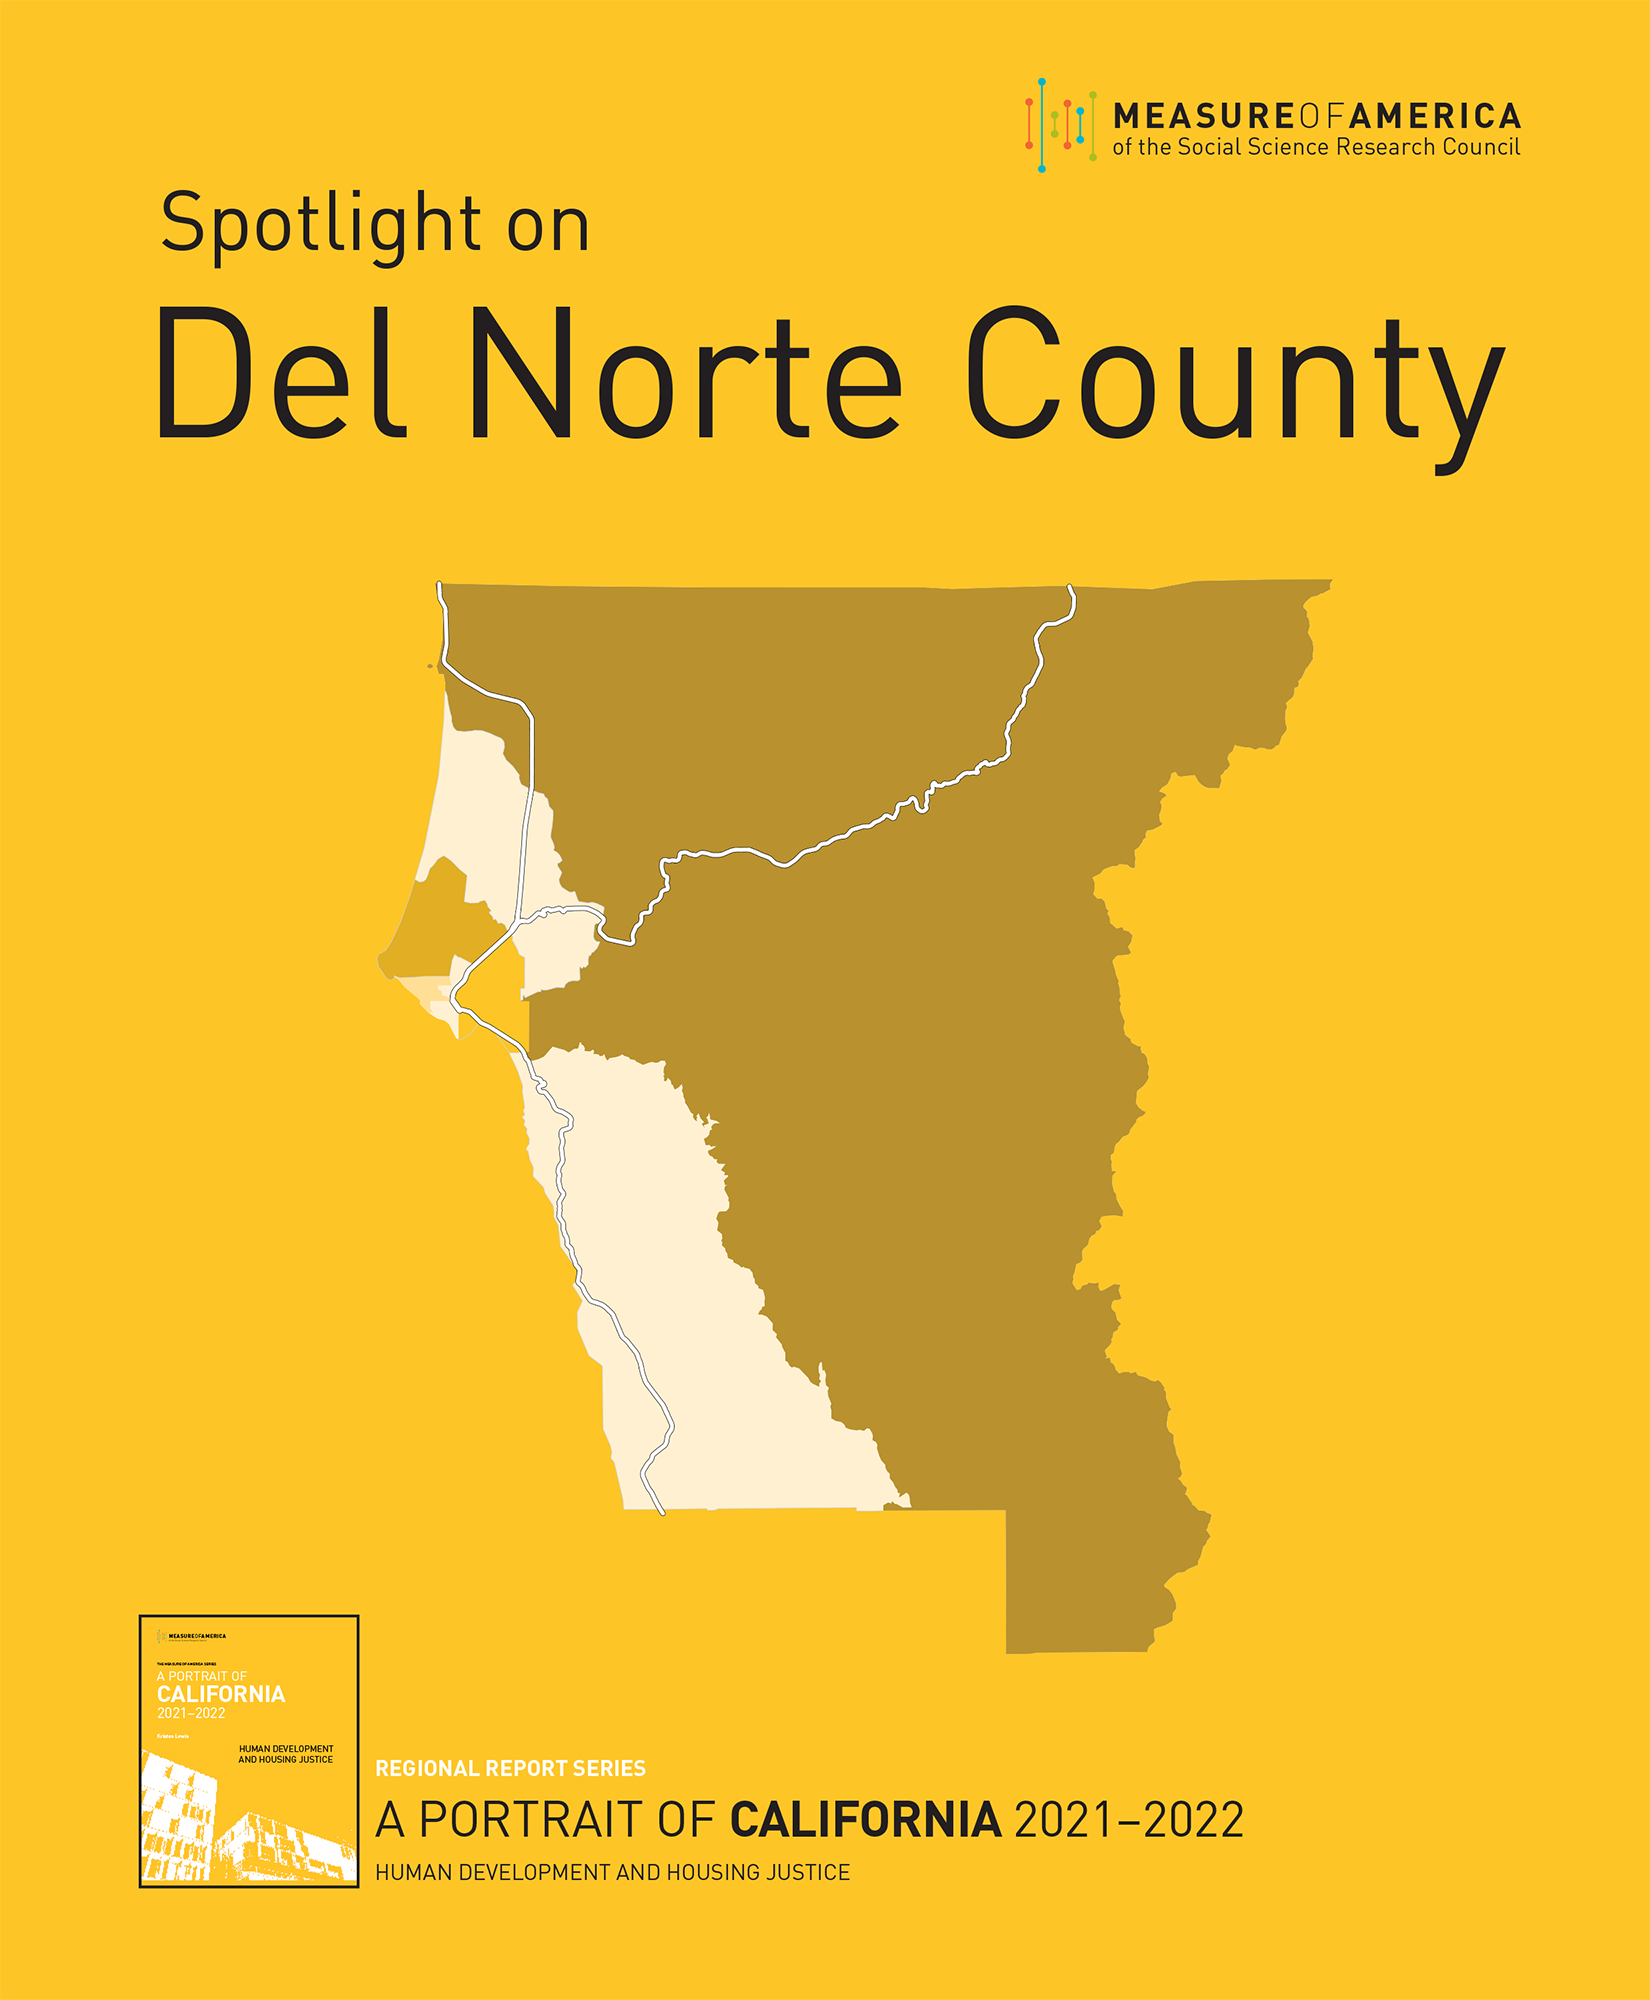 This Spotlight on Del Norte County, part of the Regional Report Series associated with A Portrait of California 2021–2022, paints a picture of well-being and access to opportunity across Del Norte County today. The Spotlight is an extensive study of well-being across race, place, and gender in this county. Using the American Human Development Index (HDI), this report presents how Del Norte County residents are doing on three key dimensions of well-being—a long and healthy life, access to knowledge, and a decent standard of living. Broken down by race and ethnicity, by gender, and by census tract, the index shows how communities across Del Norte County are faring relative to one another and to the state and country as a whole. The report found that stark variation exists by place and by demographic group—resulting in significant inequalities regionwide.
The HDI is expressed on a scale from zero to ten, with ten indicating higher levels of well-being across health, education, and standard of living. Del Norte County as a whole scores 4.17, falling significantly below the California statewide score of 5.85. Of the three racial and ethnic groups for whom it is possible to calculate an HDI score, white (4.90 out of 10) Del Norte residents have the highest levels of well-being, followed closely by Latino (4.60), with Native American (2.38) residents scoring considerably lower. Due to the small population sizes of the Asian, Native Hawaiian and other Pacific Islander, and Black populations in Del Norte, HDI score calculations are not possible for these groups.
The range of HDI scores by census tract in Del Norte County runs from a high of 5.38 in Census Tract 2.02, which includes much of the western parts of Del Norte County and towns such as French Hill, Idlewild, and Douglas Park, to a low of 2.56 in Census Tract 1.01, comprising mostly southern Crescent City.
SELECT FINDINGS:
HEALTH:
- The average life expectancy for residents of Del Norte County is 78.3 years, 2.7 years shorter than the state average. A baby girl born today in Del Norte can expect to live 80.8 years, nearly 5 years longer than a baby boy (76.1 years).
EDUCATION:
- Compared to the populations of California and the United States as a whole, adult residents of Del Norte are less likely to have earned high school diplomas and about half as likely to have earned bachelor’s degrees. While 79.7 percent of adults have at least a high school diploma, only 15.4 percent hold at least a bachelor’s degree and 5.9 percent hold a graduate degree
- Compared to boys and young men, girls and young women ages 3 to 24 have notably higher rates of enrollment in Del Norte (76.2 percent of females ages 3 to 24 are enrolled compared to 69.6 percent of males), and women enjoy an edge across all educational outcomes
LIVING STANDARDS:
- Median personal earnings in Del Norte are $30,200, about $9,700 less than in the state overall. Native American women have the lowest earnings of any race/gender combination in Del Norte County, $17,300. White men in Del Norte make more than double what Latina women earn: roughly $19,800 more. The gender gap between white men and white women comes out to $6,600 in annual earnings; the earnings gender gap between Latino men and women is $7,100 annually
Spotlight on Mendocino County
SPOLIGHT ON MENDOCINO COUNTY
RELEASED JANUARY 16, 2023
FULL REPORT | LAUNCH SLIDES | LAUNCH WEBINAR | DOWNLOAD DATA
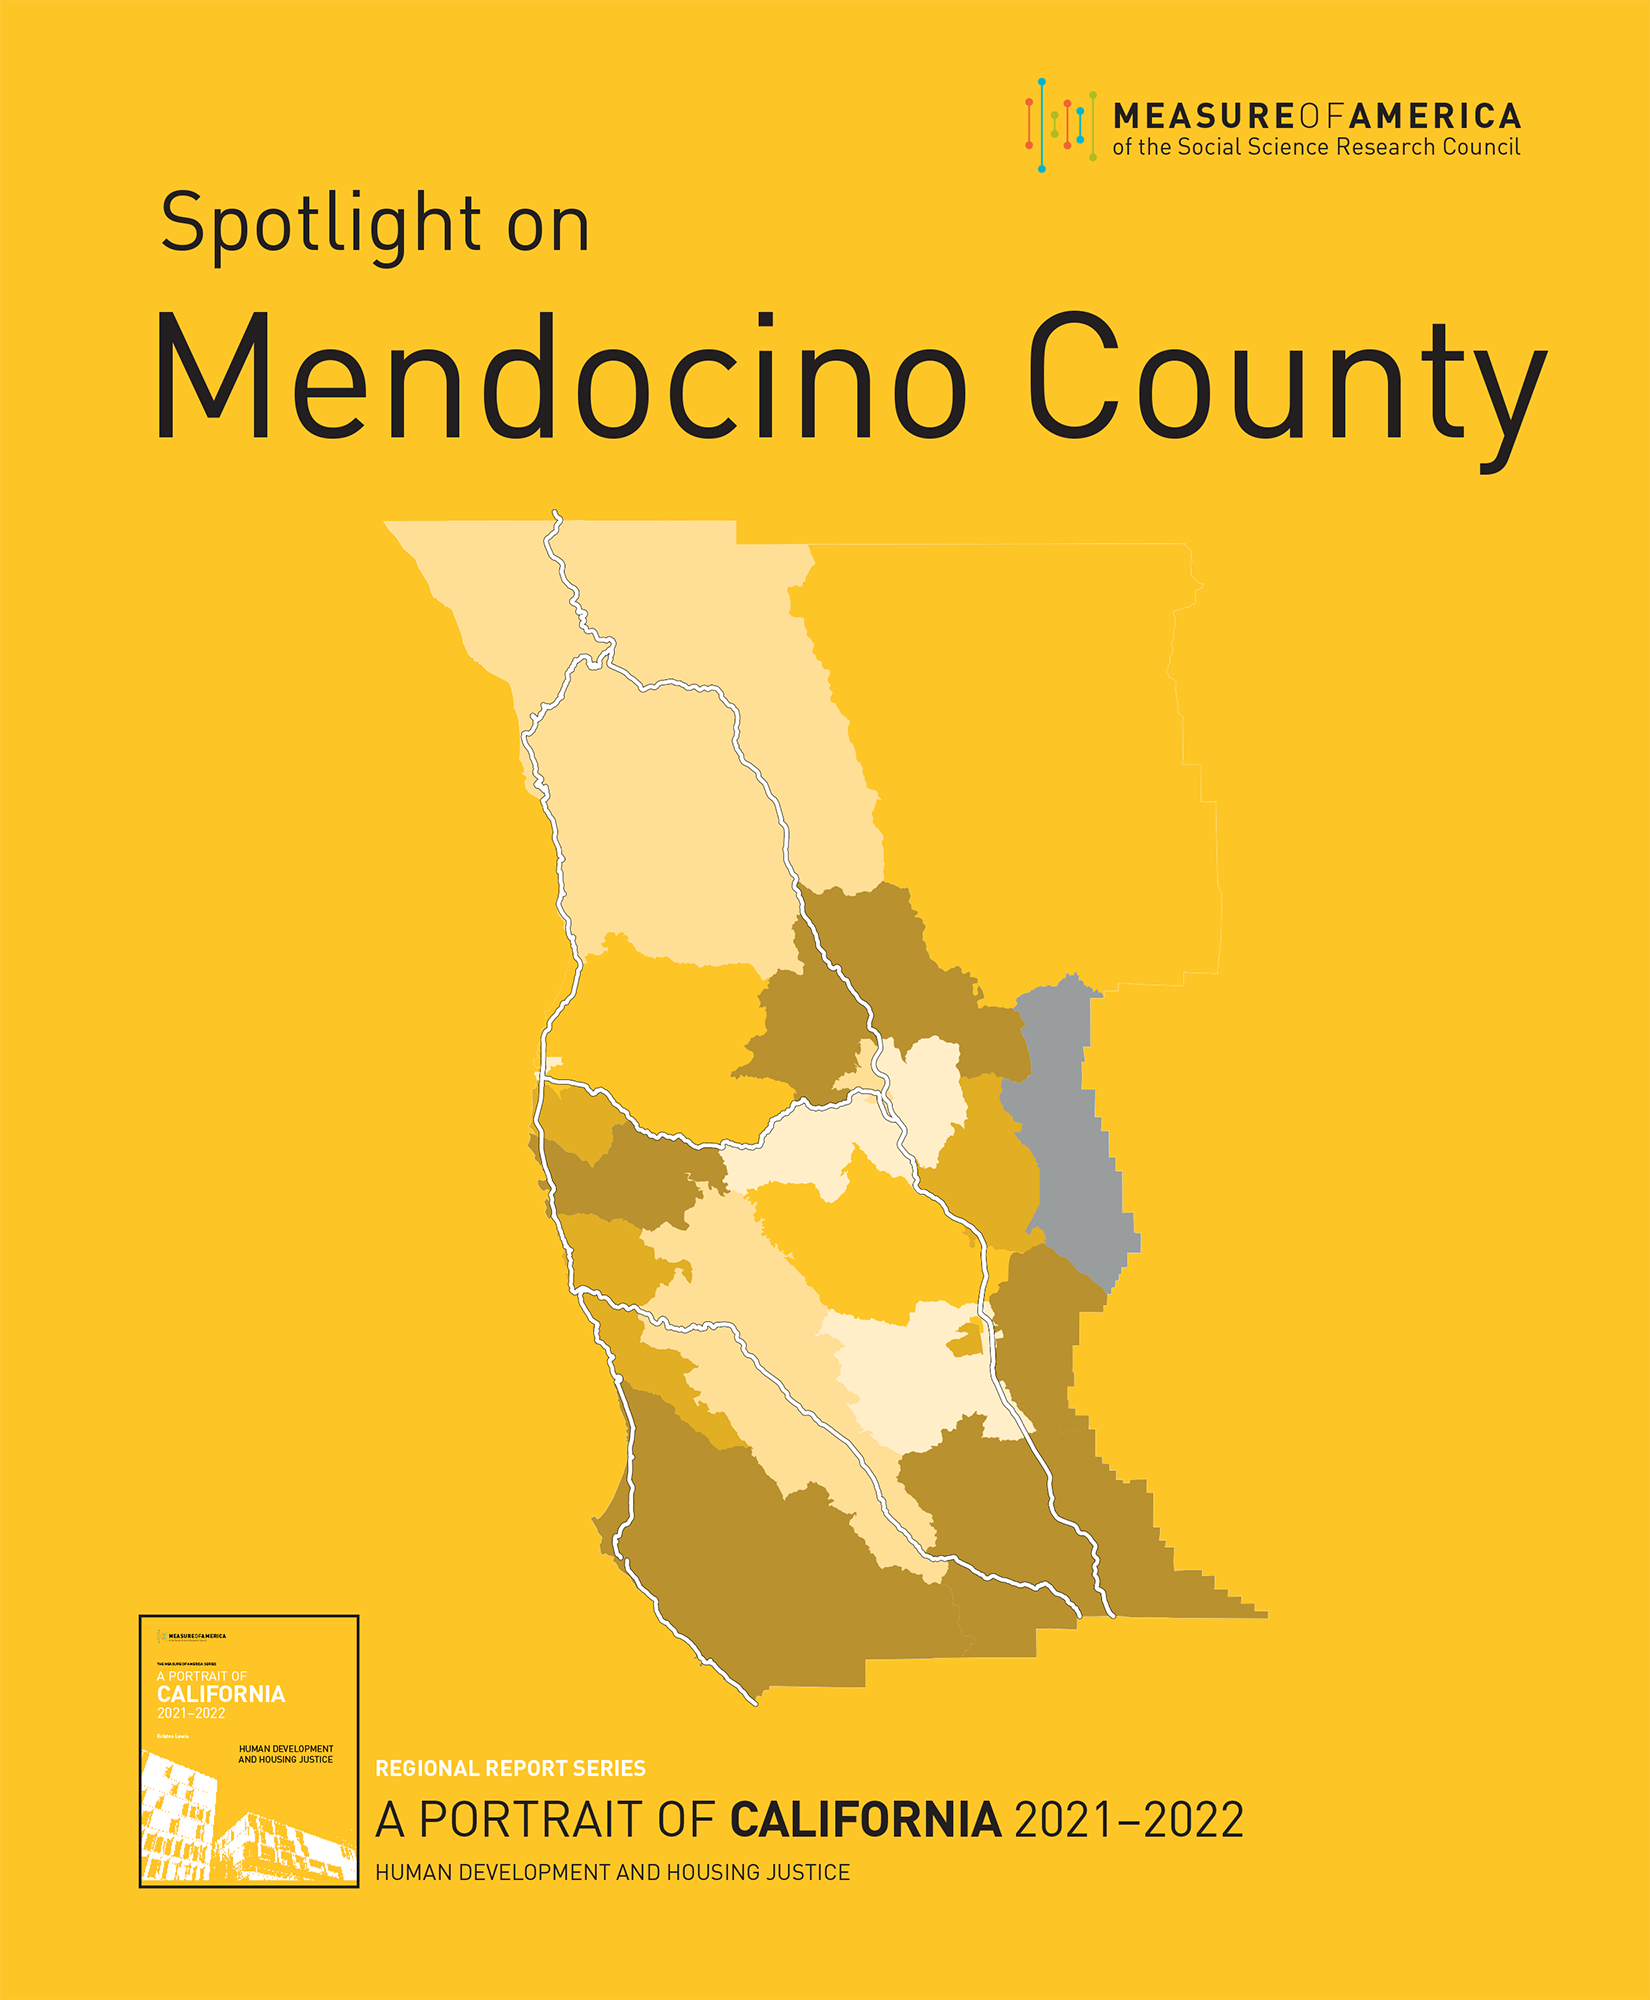 This Spotlight on Mendocino County, part of the Regional Report Series associated with A Portrait of California 2021–2022, paints a picture of well-being and access to opportunity across Mendocino County today. The Spotlight is an extensive study of well-being across race, place, and gender in this county. Using the American Human Development Index (HDI), this report presents how Mendocino County residents are doing on three key dimensions of well-being—a long and healthy life, access to knowledge, and a decent standard of living. Broken down by race and ethnicity, by gender, and by census tract, the index shows how communities across Mendocino County are faring relative to one another and to the state and country as a whole. The report found that stark variation exists by place and by demographic group—resulting in significant inequalities regionwide.
The HDI is expressed on a scale from zero to ten, with ten indicating higher levels of well-being across health, education, and standard of living. Mendocino County as a whole scores 4.53, falling significantly below the California statewide score of 5.85. Of the four racial and ethnic groups for whom it is possible to calculate an HDI score, Asian (5.71 out of 10) Mendocino residents have the highest levels of well-being, followed by white (5.37), Latino (4.71), and Native American (3.58) residents. The Black population in Mendocino County is about 600 people, which is too small to calculate a reliable HDI score. In California as a whole, the Black score is 4.44.
The range of HDI scores by census tract in Mendocino County runs from a high of 6.74 in Census Tract 117, which includes areas east of Ukiah including Regina Heights, Talmage, Vichy Springs, and the Guidiville Rancheria, to a low of 3.16 in Census Tract 115.02, which includes the northeastern section of Ukiah and Orrs Creek as well as Oak Manor.
SELECT FINDINGS:
HEALTH:
- The average life expectancy for residents of Mendocino County is 78.8 years, 2.3 years shorter than the state average. A baby girl born today in Mendocino can expect to live 82.4 years, 6.9 years longer than a baby boy (75.5 years).
EDUCATION:
- Compared to California as a whole, adult residents of Mendocino are slightly more likely to have graduated from high school and less likely to have earned bachelor’s degrees. While 86.7 percent of adults have at least a high school diploma, 24.0 percent hold at least a bachelor’s degree and 9.2 percent hold a graduate degree.
- Compared to boys and young men, girls and young women ages 3 to 24 have notably higher rates of enrollment in Mendocino (79.1 percent of females ages 3 to 24 are enrolled compared to 75.4 percent of males) and enjoy an edge across all educational outcomes—though this educational advantage is not reflected in their earnings.
LIVING STANDARDS:
- Median personal earnings in Mendocino are $28,500, about $11,400 less than in the state overall. The gender gap in earnings is persistent across the United States and California. For the state as a whole, women earn 73 cents for every dollar men earn. That pattern holds in Mendocino, where women earn 71 cents for every dollar men earn. This translates into a gap of $9,300 in annual earnings, as men earn $32,800 compared to $23,500 for women.
A Portrait of the Valley
A PORTRAIT OF THE VALLEY: SAN JOAQUIN VALLEY HUMAN DEVELOPMENT REPORT 2023
RELEASED MAR 9, 2023
FULL REPORT | PRESS RELEASE | DOWNLOAD DATA
 A Portrait of the Valley: San Joaquin Valley Human Development Report 2023, paints a picture of well-being and access to opportunity across the San Joaquin Valley today. The Portrait is an extensive study of well-being across race, place, and gender in the eight-county San Joaquin Valley region. Using the American Human Development Index (HDI), this report presents how Valley residents are doing on three key dimensions of well-being—a long and healthy life, access to knowledge, and a decent standard of living. Broken down by race and ethnicity, by gender, and by census tract, the index shows how communities across the San Joaquin Valley are faring relative to one another and to the state and country as a whole. The report found that stark variation exists by place and by demographic group—resulting in significant inequalities regionwide.
A Portrait of the Valley is part of a larger project, A Portrait of California 2021–2022, which explores well-being in the state as a whole, with a special focus on housing.
The HDI is expressed on a scale from zero to ten, with ten indicating higher levels of well-being across health, education, and standard of living. The San Joaquin Valley as a whole scores 4.31, falling significantly below the California statewide score of 5.85. Of the six racial and ethnic groups for whom it is possible to calculate an HDI score, Asian (5.55 out of 10) and white (5.18) Valley residents have the highest levels of well-being. Residents who identify as Native Hawaiian and other Pacific Islander (4.17), Latino (3.87), Black (3.32), and Native American (2.67) have much lower scores, indicating the greater challenges to well-being and access to opportunity these groups face.
Among census tracts in the San Joaquin Valley, HDI scores range from a low of 0.96 in Census Tract 13.01 in Kern County to a high of 8.58 in Census Tract 43.01 in Fresno County. Over 200 census tracts in the Valley—more than one in five—score below 3.0 on the 10-point HDI scale. Residents of these areas face more barriers to opportunity than do those who live in the San Joaquin Valley’s higher-scoring areas. They have much lower levels of well-being—shorter life expectancies, less access to education, and extremely low earnings—than others in the region or the state, on average. The residents of these census tracts tended to be most vulnerable when the Covid-19 pandemic hit and continue to face the greatest challenges to recovery today.
SELECT FINDINGS:
HEALTH:
- The average life expectancy for residents of the San Joaquin Valley is 78.2 years, 2.9 years shorter than the state average. A baby girl born today in the San Joaquin Valley can expect to live 81.0 years, a baby boy, 75.6 years—a 5.4-year difference.
EDUCATION:
- Compared to adults ages 25 and up in California as a whole, adult residents of the San Joaquin Valley are less likely to have earned a high school diploma, 84.5 percent compared to 76.1 percent, and about half as likely to hold a bachelor’s degree, 37.1 percent compared to 18.0 percent.
- San Joaquin Valley young people between the ages of 3 and 24 are about as likely to be enrolled in school as other young Californians, however. Compared to boys and young men, girls and young women ages 3 to 24 have slightly higher rates of school enrollment in the San Joaquin Valley, and women ages 25 and up enjoy an edge over their male counterparts across all educational outcomes, from high school graduation to graduate degree attainment—though this educational advantage is not reflected in their earnings.
LIVING STANDARDS:
- Median personal earnings in the San Joaquin Valley are $31,100, about $8,800 less than in the state overall. Men vastly outearn women, $35,900 versus $25,500, a difference of $10,400. Though the sizes of the earnings gaps vary by race and ethnicity, women across the San Joaquin Valley earn much less than men, a phenomenon also found in California and in the country as a whole.
Spotlight on Del Norte County & Spotlight on Mendocino County
SPOTLIGHT ON DEL NORTE COUNTY & SPOTLIGHT ON MENDOCINO COUNTY
RELEASED JANUARY 16, 2023
 |
 |
Spotlight on Del Norte County and Spotlight on Mendocino County paint a picture of well-being and access to opportunity in Mendocino and Del Norte Counties today. The creation of the Spotlights was guided by an public servants, advocates, scholars, and nonprofit leaders from Del Norte and Mendocino Counties. These Spotlights are all part of a larger project, which explores well-being in the state as a whole, with a special focus on housing: A Portrait of California 2021–2022.
Using the American Human Development Index (HDI), these two Spotlights present how Mendocino County and Del Norte County residents are doing on three key dimensions of well-being—a long and healthy life, access to knowledge, and a decent standard of living. Broken down by race and ethnicity, by gender, and by census tract, the HDI shows how communities across Del Norte County and Mendocino County are faring relative to one another and to the state and country as a whole.
For media and all other inquiries, contact us at: contact@measureofamerica.org
A Portrait of California 2021–2022
LAUNCHED NOVEMBER 10, 2021
Regional Report Series: Inland Empire | Sonoma County | San Joaquin Valley | Del Norte County | Mendocino County | Rural California
 A Portrait of California 2021–2022: Human Development and Housing Justice, the third volume in Measure of America’s Portrait of California series, takes a human development approach to understanding the country’s most populous and diverse state. Using the American Human Development Index (HDI), it presents a detailed picture of how Californians are doing on three key dimensions of well-being—a long and healthy life, access to knowledge, and a decent standard of living. In addition to an in-depth survey of well-being levels across the state, this volume in the Portrait of California series focuses on a central prerequisite to a good life, one that far too many Californians struggle to attain: access to safe and secure housing. The Covid-19 pandemic dramatically underscored the importance of stable, affordable housing when it comes to access to education, living standards, and health. A Portrait of California 2021–2022: Human Development and Housing Justice explores the impact of California’s housing crisis on all three components of the index and outlines policies that can help the state address homelessness and housing insecurity to ensure that all Californians have a safe place to call home.
This report presents HDI scores for the state overall as well as by gender, by race and ethnicity, by nativity, by metro area, and by neighborhood cluster. In addition to providing HDI scores for various groups and geographies, it also delves deeper into the underlying causes of the gaps in well-being between them—structural racism, discrimination, sky-high housing costs, among others—and offers recommendations for addressing these challenges and building a fairer future for the Golden State, one in which every Californian can lead a freely chosen life of value.
KEY FINDINGS
AMERICAN HUMAN DEVELOPMENT INDEX
- California scores 5.85 out of 10 on the American Human Development Index, with gains in all three components of the HDI since 2009. California’s HDI score is higher than the country’s as a whole and has improved at a faster rate.
- Looking at scores by race and ethnicity, however, reveals that of the state’s six major racial and ethnic groups, only two—Latino and Asian Californians—have seen improvement in overall well-being. Latino Californians experienced the greatest increase on the HDI of any racial or ethnic group, from 3.99 in Portrait of California 2011 to 4.81 now. The scores for white, Black, and Native American Californians declined between 2009 and 2019. Since 2000, the HDI score for Native American Californians has declined by an alarming 22.5 percent, the sharpest drop experienced by any group. This is the first year for which we have an HDI score for Native Hawaiian and Other Pacific Islander (NHOPI) Californians, 4.20.
- Overall, women in California score slightly higher than men, 5.81 compared to 5.73, faring better on the health and education components of the index. Black, Latina, Native American, and NHOPI women all score higher than their male counterparts, while white and Asian women score lower due to the especially large gender earnings gaps within these groups.
- Greater San Jose scores the highest on the HDI of California’s metro areas, 8.09, while Madera scores the lowest. Greater Los Angeles contains the widest well-being range in the state.

FIVE CALIFORNIAS
While comparing the highest- and lowest-scoring areas is useful for understanding California’s human development extremes, most places fall somewhere along the vast well-being continuum present in the state. In order to make sense of California’s 265 neighborhood clusters and to highlight commonalities shared by different places, this report sorts areas with similar HDI scores into five groups:
- One Percent California comprises six neighborhood clusters with scores of 9.00 or higher on the HDI, five of which are located in the Bay Area. The 900,000, people, 2.3 percent of the state population, living in these communities enjoy higher levels of well-being and greater access to opportunity than almost anyone in the country.
- Elite Enclave California is home to roughly eight million people, or one-fifth of the state’s population. Its fifty-six neighborhood clusters, scoring between 7.00 and 8.99 on the index, are found almost entirely in the Bay Area, Los Angeles, and San Diego.
- Main Street California neighborhood clusters score between 5.00 and 6.99 on the HDI. More than eighteen million people, 46 percent of the population, live in one of these 121 areas. Main Street Californians have higher levels of wellbeing than the average US resident. Nonetheless, California’s high cost of living means that some Main Streeters face levels of economic insecurity similar to that of Struggling California.
- Struggling California is made up of eighty-two neighborhood clusters with index scores between 3.00 and 4.99, found chiefly in greater Los Angeles, the Inland Empire, the Central Valley, greater San Diego, and northern California. Its residents, who make up roughly 30 percent of the state’s population, have lower levels of well-being than the typical American.
- Disenfranchised California comprises areas that score below 3.00 on the HDI. Today, none of the state’s 265 neighborhood and town clusters meet this criteria, compared to nine in A Portrait of California 2014–2015 and eleven in the 2011 volume.
A LONG AND HEALTHY LIFE
- The health component of the index is measured by life expectancy at birth. A baby born in California today can expect to live 81.0 years on average, compared to 78.8 years in the US overall. Since 2012, life expectancy in California—and in the country as a whole—has dropped by 0.2 years.
- Of the state’s major racial and ethnic groups, Native American Californians have the shortest life expectancy, 71.2 years, and have experienced the greatest loss in life expectancy since 2012, a decrease of over 8 years. Asian Californians live the longest, on average, 87.0 years, although life expectancies vary significantly among Asian subgroups. Black Californians’ life expectancy (74.1 years) decreased by a concerning 1.5 years between 2012 and 2019, and has no doubt fallen further due to the pandemic.
- Over 12 years separate the life expectancies of the longest- and shortest-living neighborhood clusters, Milpitas & Northeast San Jose (87.3 years) and West San Bernardino (75.0 years). The neighborhood clusters with the longest average life expectancies have a relatively higher proportion of Asian residents, while neighborhoods at the bottom of the list tend to have a relatively higher proportion of Black or Latino residents, highlighting the negative impact of residential segregation on health outcomes.
 ACCESS TO EDUCATION
- California is ahead of the United States overall on the education dimension of the index, measured by a combination of degree attainment and school enrollment indicators. Compared to the US as a whole, California has slightly higher bachelor’s and graduate degree attainment rates, but the share of adults age 25 and older without a high school degree in California, 15.9 percent, is higher than the national rate, 11.4 percent.
- While California fares better overall on the education component of the index than the country as a whole, gaps between racial and ethnic groups persist. Even where the Latino Education Index score is the highest—the rural Humboldt County area—Latinos score more than one point below the average Californian and well below the local white population.
- Education and income are closely linked in California. The highest-educated neighborhood clusters are concentrated in the affluent neighborhoods and suburbs of three major metropolitan areas, the Bay Area, Los Angeles, and San Diego. Conversely, the neighborhoods with the lowest Education Index scores—concentrated in urban city centers in Los Angeles as well as in both urban and rural communities in the Central Valley and the Inland Empire—are among the lowest-earning in the state.
- California’s youth disconnection rate—the share of teens and young adults who are neither working nor in school—is 10.3 percent and declined each year for the past decade. Unfortunately, we anticipate that data from 2020 and 2021 will show pandemic-induced spikes in the youth disconnection rate. Wide disparities between different geographies and groups persist: Asian and white young people have the lowest disconnection rates, 6.0 percent and 8.9 percent, respectively, while Black and Native American youth have the highest, 18.4 percent and 23.2 percent.

 A DECENT STANDARD OF LIVING
- The standard of living dimension of the index is measured by median personal earnings. In California, the typical worker takes home $39,500 annually, $3,000 more than the US median. White workers earn the most ($51,700), followed by Asian workers ($51,100), NHOPI workers ($38,200), Black workers ($36,400), Native American workers ($32,400), and Latino workers ($30,200).
- Earnings gaps are even more striking when gender is taken into account: at the high end of the earnings scale, white men take home $61,600 each year, while Latina women, the lowest-paid group in the state, earn just $25,100. Although the size of the gaps varies, women earn less than men in each major racial and ethnic group, and the Covid-19 pandemic threatens to set women—especially women of color—even further back.

- In each of California’s metro areas, white workers earn more than the state median, while Latino workers earn less. The Latino-white pay gap is widest in San Jose, where Latinos earn $0.46 for every dollar earned by white workers.
- A difference of nearly $100,000 separates California’s highest- and lowest-earning neighborhood clusters: earnings range from $22,100 in Los Angeles’ East Vernon neighborhood to $120,400 in Cupertino, Saratoga & Los Gatos in Santa Clara County.
A Portrait of Los Angeles County
To view the updated report, click here.
LAUNCHED NOVEMBER 29, 2017
FULL REPORT | MEDIA RELEASE | INTERACTIVE MAP
 A Portrait of Los Angeles County is an exploration of how LA County residents are faring in terms of well-being and equity. It examines well-being and access to opportunity using the human development framework and index, presenting American Human Development (HD) Index scores for LA County places and demographic groups and exploring a range of critical issues, including health, education, living standards, environmental justice, housing, homelessness, violence, and inequality.
The American Human Development Index, a supplement to the gross domestic product and other money metrics, tells the story of how ordinary people are doing. The index is based on the Human Development Index developed by the United Nations, the gold standard for measuring the well-being of people in every nation. This report is the fifth that Measure of America has produced on the state of California; previous reports include A Portrait of Marin, A Portrait of Sonoma County, and two volumes of A Portrait of California.
For this report, a ranked index has been calculated for 106 cities and unincorporated areas in LA County as well as the thirty-five community plan areas within the City of Los Angeles; for major racial and ethnic groups; for women and men; and for US- and foreign-born LA County residents.
Key Findings:
American Human Development Index
- LA County’s overall HD Index score is 5.43 out of 10, which is higher than the US value of 5.17. This average masks huge variation, however. Some places and groups of Angelenos have very high scores and enjoy the highest levels of well-being in the country, while others face challenges akin to those found in impoverished areas of Appalachia and the Mississippi Delta.
- The highest-scoring locale in LA County is the City of San Marino at 9.43, and the lowest-scoring is Florence-Graham at 2.44.
- The American Human Development Index scores of Los Angeles County’s major racial and ethnic groups vary from relatively high scores for Asian and white Angelenos to far lower scores for Native American, black, Native Hawaiian and other Pacific Islander, and Latino residents. Among these groups, Asians score the highest on the HD Index (7.37), and Latinos score the lowest (4.32).
A Long and Healthy Life
- If LA County were a country, its would rank eleventh in the world in longevity, with a life expectancy of 82.1 years. Angelenos can expect to live nearly three years longer than the average American and several months longer than the average Californian.
- Walnut Park has the county’s longest life expectancy, a remarkable 90.5 years, while Sun Village has the shortest, 75.8 years. For an in-depth exploration of life expectancy in LA County by place, see Highway to Health: Life Expectancy in Los Angeles County.
- Among major racial and ethnic groups, the longest-lived population is Asians, with a life expectancy of 87.3 years. Native Hawaiians and other Pacific Islanders (NHOPI) have a life expectancy of 75.4 years—almost a dozen-year gap. Asian and Latino Angelenos live longer than the average LA County resident; the remaining groups have life expectancies below the county average.
- Among Asian subgroups large enough to allow for reliable calculations, Indian and Chinese Angelenos have the longest life expectancy (88.1 years) and Filipinos have the shortest (85.5 years)—though the Filipino life expectancy is still 3.4 years longer than the countywide average.
- Women’s life expectancy is 4.9 years longer than men’s. Women live longer than their male counterparts in every racial and ethnic group, though the size of the gap varies.
Access to Education
- LA County lags behind the United States as a whole in educational attainment, in large part due to the comparatively large share of adults without a high school degree. LA County scores 4.96 on the Education Index (compared to 5.11 for the US), and more than one in five adult Angelenos lack a high school diploma.
- The highest-ranking community in LA County is Westwood in the City of LA (home to UCLA), with an Education Index score of 9.95. The lowest-ranking community, with a score of just 1.24, is Florence-Graham, which also ranks the lowest on the overall HD Index.
- Asians score the highest on the Education Index at 7.12, followed closely by whites at 7.02. The next-highest scores are significantly lower—4.69 for NHOPI and 4.64 for blacks. The lowest-scoring group is Latinos at 2.80; more than 40 percent of Latino adults over age 25 lack a high school diploma.
- Overall, women (5.10) tend to have higher educational attainment levels than men (4.82) in LA County, though this trend is flipped among Asians and NHOPI; in these groups, men edge out women.
- The disconnected youth rate—the share of young people ages 16–24 who are neither working nor in school—is a statistic that MOA calculates using public use microdata areas (PUMAs). There is a strong relationship between well-being in a community and the rate of young people who are connected to school or work. The overall youth disconnection rate in LA County (11.8 percent) is slightly lower than the US rate (12.3 percent). The area in LA with the lowest youth disconnection rate is West Central/Westwood and West LA in the City of LA (3.9 percent), and the area with the highest rate is South Central and Watts, also in the City of LA (23.0 percent).
A Decent Standard of Living
- Median personal earnings in LA County are $30,700, slightly less than the US median of $31,416. The range within LA County, however, is striking—from a peak of $82,813 in Palos Verdes Estates to a mere $16,044 in Westwood, no doubt due to the large student population there. Median personal earnings are the wages and salaries of the person in the middle of the earnings distribution; half the population earns more than the median, and half earns less.
- Whites earn the most ($47,600) in LA County among the major racial and ethnic groups; this is the only component of the index for which whites outscore Asians ($38,000). Latinos in LA County earn the least, with median personal earnings of $22,600. Black Angelenos earn $6,500 more than blacks in the United States as a whole.
- Despite outscoring men in the overall HD Index and in both health and education, women earn less than men in every racial and ethnic group and tend to occupy lower-paying occupations and industries. Women continue to take on a disproportionate amount of unpaid caretaking labor, incur motherhood penalties, and experience wage discrimination.
Conclusion
Shoring up the foundations of well-being for all county residents as well as building on the strengths and expanding the opportunities of the groups that are struggling today is key to a flourishing LA County tomorrow. The report thus concludes with an ambitious goal: to increase well-being for all county residents and narrow the gaps between groups, resulting in a one-point increase in the HD Index, from today’s 5.43 to 6.43, by 2025.
To achieve this goal in a way that results in measurable well-being improvements for all, with a focus on the county’s most vulnerable residents, the following areas are priorities:
- Health: Addressing the social determinants of health, including economic security, through targeted efforts will extend life expectancy for all and achieve significant gains for the groups with the lowest life expectancies. Increase average life expectancy countywide by six months, from 82.1 years to 82.6 years, over this eight-year period and increase life expectancy for black, Native Hawaiian and other Pacific Islander, and Native American residents to 80 years.
- Education: Investing in parental education, quality child care, early childhood education, school integration, funding equality, and young people at risk for disconnection increases the likelihood that students will enroll in school and complete their degrees. Increase enrollment by 10 percent and boost adult educational attainment by 10 percent, focusing in particular on Struggling LA and Precarious LA and on Latinos countywide.
- Earnings: Increasing wages, improving workforce training and protections, and reducing the gender earnings gap will lift median personal earnings, enabling greater economic security and a chance for all Angelenos to invest in themselves and provide a safe, stable environment for the next generation. Increasing median earnings in the county by $8,000 (in inflation-adjusted dollars) over the eight-year period with an eye toward income equality will require a laser focus on workers whose median personal earnings are very low, namely Latinos and those in Precarious LA ($19,000 annual median personal earnings) and Struggling LA ($25,000).
A Portrait of California 2014–2015
LAUNCHED TUESDAY, DECEMBER 9, 2014
FULL REPORT | MEDIA RELEASE | INTERACTIVE MAP | DOWNLOAD DATA TABLES
 If California were a country, it would rank 34th in the world by population and 8th by the size of its economy—big enough for a seat at the G8. But that’s not the whole story. Instead of relying only on economic analysis, Measure of America’s A Portrait of California uses the human development approach to tell us how people are doing. Three dimensions—a long and healthy life, access to knowledge, and a decent standard of living—are examined in detail and presented along a simple ten-point scale: the American Human Development (HD) Index.
Toni Atkins, the Speaker of the California State Assembly, wrote the report’s foreword, stating: “This fact-based exploration of how children and their communities across California are doing is a must-read for policymakers, business leaders, philanthropists, and anyone who cares about our future…I urge my colleagues, and everyone concerned with California’s future, to use this report to inform our work in the coming years.”
KEY FINDINGS
Income inequality is in the headlines these days, and attention to this huge and growing problem is welcome. But to focus on inequality in income alone is to take a narrow view of the problem and what’s at stake. Mutually reinforcing inequalities in health, education, environment, neighborhood conditions, wealth, and political power have created an opportunity divide that higher wages alone cannot bridge. [layerslider id=”7″]
This 2014–2015 update of the 2011 California report allows us to compare
outcomes from one place to another and to look at changes over time. The result is a comprehensive reference tool and a critical starting point for informed discussions on policy solutions.
FIVE CALIFORNIAS
Inequalities in health, education, and earnings divide California communities in ways that challenge conventional north-south and inland-coastal divisions in the state. By using the HD Index score to sort county, town, and neighborhood clusters,we have identified “Five Californias,” each with its own distinct well-being profile.
- One Percent California consists of the two neighborhood clusters that score 9 or above out of 10 on the HD Index; these neighborhoods are home to just under one in every one hundred Californians.
- Elite Enclave California is made up of neighborhood clusters that score between 7 and 8.99 on the Index; 15 percent of Californians are part of this group.
- Main Street California comprises neighborhood clusters that score between 5 and 6.99 and is home to 39 percent of Californians.
- Struggling California is home to the largest share of the state’s population, 42 percent, with these neighborhood clusters scoring between 3 and 4.99 on the Index.
- Disenfranchised California comprises neighborhood clusters that score below 3 on the HD Index; this California is home to roughly 3 percent of the state’s population.
The Five Californias also gives us a window into California’s future. The HD Index numbers make plain the need to address the future of the state in two ways: by preventing problems from taking root in childhood and by helping parents. Together, Struggling and Disenfranchised California are home to almost half the state’s population and to more than half (50.9 percent) of the state’s children. In Struggling California, nearly one in five teens and young adults fall into the “disconnected youth” category, or youth ages 16 to 24 who are neither working nor in school.
A PORTRAIT OF CALIFORNIA: OVERALL
- Though California made substantial human development progress from 2000 to 2005, the state has been treading water in terms of well-being since 2005; the HD Index score was 5.39 on this ten-point scale in 2005 and again in 2012.
- The state’s HD Index score exceeds the national average (5.07), but scores by county, metro area, and neighborhood cluster reveal large variations in fundamental health, education, and earnings outcomes within the state. The greatest geographical variations are often found within, rather than between, counties and metro areas.
- Of the state’s ten largest metro areas, San Jose tops the well-being chart, with an HD Index score of 7.08, higher than the top-ranking state, Connecticut. At the other end of the rankings table is Bakersfield, with an Index score of 3.69, lower than the worst-performing state, Mississippi. Fresno ranks ninth, with an Index score of 3.96—on par with well-being levels in West Virginia.
HEALTH
- Health is a good news story from 2000 to 2012: life expectancy at birth in California increased by 2.7 years to 81.2 years. Californians live longer than the average American, ranking fourth among states on this fundamental indicator.
- But at the neighborhood level, the story changes. Nearly a dozen years separate the top and bottom neighborhood clusters in California, from a life expectancy of 87.0 years in parts of northwest Santa Clara to 75.3 years in Twenty-Nine Palms City and Barstow City in San Bernardino County.
- By race and ethnicity, Latinos outlive whites in California by 3.6 years. African American men have the lowest life expectancy of all race, ethnicity, and gender categories, 72.8 years, just under the male life expectancies of Tunisia and Vietnam. This is in part the result of tragically high premature death rates among men due to heart disease, homicide, and cancer.
EDUCATION
- More education is associated with a range of positive outcomes that extend well beyond better jobs and bigger paychecks. Measure of America’s research suggests, for example, that if every Californian adult were to magically “move up” just one education level, nearly 1 million fewer Californians would live in poverty, life expectancy would increase by 1.6 years, 1,200 fewer Californians would be murdered each year, and 2.4 million more Californians would vote in elections.
- Change in educational attainment since 2000 has been very positive. A higher percentage of Californian adults 25 years and older hold bachelor’s and graduate degrees than they did in 2000, and the share of adults who lack a high school diploma fell from 23.2 percent in 2000 to 18.5 percent in 2012—though that rate is still about 5 percentage points higher than the national average.
- Latinos have the lowest educational attainment score, lagging in school enrollment for those ages 3 to 24 as well as in the proportion of adults who have completed high school, a bachelor’s, and a graduate degree. However, U.S.-born Latino adults are slightly more likely than the average Californian to have graduated high school, a trend that bodes well for Latino educational levels in the next generation.
- The youth disconnection rate (the share of young people ages 16 to 24 who are neither working nor in school) is cause for concern. In the ten most populous California metro areas, the rate ranges from a low of 10.4 percent in Oxnard–Thousand Oaks to more than double that, 24.2 percent, in Bakersfield. More striking still is the youth disconnection range within large metro areas by race and ethnicity.
EARNINGS
- What has stymied overall human development progress in recent years? The culprit is the decline in earnings. California’s median earnings in 2005, $33,305, were 16 percent higher than they were in 2012. Median earnings are the wages and salaries of the typical worker.
- California’s agriculture feeds the nation, but the state’s crop workers struggle to buy groceries, with annual earnings that range from $15,000 to $17,500.
- Median earnings by metro area range from San Jose, at over $42,000 to Fresno, with earnings of under $23,000, slightly more than half what the typical San Jose worker is earning.
- White men outearn white women by almost $18,000. The gender pay gap for the state’s other major racial and ethnic groups ranges from about $4,000 between Native American men and women to a gap of about $10,000 among Asian Americans. Wage inequality is not just a women’s issue; most California families depend on women’s earnings to make ends meet.
________________________________________________________
For media and all other inquiries, contact us at: contact@measureofamerica.org | (718) 517-3720.
A Portrait of Sonoma County
A PORTRAIT OF SONOMA COUNTY: 2021 UPDATE
RELEASED JANUARY 26, 2022
 A Portrait of Sonoma County: 2021 Update, a follow-up to our 2014 report, paints a picture of well-being and access to opportunity in Sonoma County today, identifies areas of positive change, and draws attention to both new and persistent challenges. Like the 2014 report, this edition was guided by an advisory group of Sonoma County organizations and individuals. It is part of a larger project, A Portrait of California 2021–2022, which explores well-being in the state as a whole, with a special focus on housing. Using the American Human Development Index (HDI), this report presents how Sonomans are doing on three key dimensions of well-being—a long and healthy life, access to knowledge, and a decent standard of living. Broken down by race and ethnicity, by gender, and by census tract, the index shows how communities across Sonoma County are faring relative to one another and to the state and country as a whole.
The severe wildfire seasons of recent years coupled with the Covid-19 pandemic altered aspects of Sonoma County residents’ lives almost beyond recognition, leading to displacement, job loss, educational disruption, significant mental health challenges, and increased deaths due not just to the coronavirus but also to drug overdose. But some of the challenges of 2021 echo those of 2014: an even worse affordable-housing shortage, economic insecurity, and disproportionate harm falling on communities of color. Though the years since the publication of the 2014 report saw heartening improvement in some indicators of well-being and a narrowing of the gaps between different places and populations, including more people with health insurance and fewer people living in poverty, deep-rooted challenges and new problems alike demand attention and action.
Connect to the County of Sonoma here: http://upstreaminvestments.
SELECT FINDINGS:
Sonoma County’s HDI score is 6.19 out of a possible total of 10, up from 5.42 in 2012. This score is well above the United States’ HDI score of 5.33 and the California HDI score of 5.85. Sonoma’s HDI lead over California’s is primarily due to high Health and Education Index scores; median earnings in Sonoma, $40,531, are just slightly higher than the Californian median of $39,528. Overall, Sonoma residents can expect to live 82.2 years—one year longer than the statewide life expectancy—and attain high school, college, and graduate school degrees at higher rates than is typical in California. Rankings on the American Human Development Index are provided by race and ethnicity, by gender, and by census tract.
HEALTH:
- The average life expectancy in Sonoma County is 82.2 years, 1.2 years longer than the state average.
- Since 2014, life expectancy in Sonoma County has increased by 1.2 years, jumping ahead of the state as a whole, which has seen its life expectancy drop by 0.2 years.
- Among census tracts, life expectancy in Sonoma County ranges from 73.2 years in Burbank Gardens (Santa Rosa) to 86.8 years in Old Healdsburg, a difference of over thirteen years.
EDUCATION:
- Despite Sonoma’s high educational attainment, there are significant disparities in degree attainment by census tract. In Sea Ranch/Timber Cove, six in ten adults 25 years and older hold bachelor’s degrees, whereas in Sheppard just over one in ten do.
- These educational disparities exist not only among geographies but also along racial lines. Only 63.8 percent of Latino Sonoma residents hold a high school diploma, as opposed to 96.0 percent of white residents. Latino residents have substantially lower rates of degree attainment than Sonoma residents of any other race. These disparities are largely due to the limited opportunities Latino immigrants had to complete their educations in their home countries. However, Latino youth are enrolled in school at rates similar to the county average: 77.1 percent are enrolled; the county average is 78.4 percent.
- Native Americans have particularly high rates of school enrollment—94.8 percent of Native American children and young people between the ages of 3 and 24 are enrolled in school. Black residents have the lowest rate of school enrollment, 69.3 percent.
LIVING STANDARDS:
- Overall, Sonoma County residents take home $1,000 more annually than the typical resident of California. Since the 2014 report, the earnings of Sonoma County residents have increased by about $7,000 (adjusted for inflation).
- Despite having higher Education Index scores, women earn much less than men, with men taking home $11,500 more than women in Sonoma County. This gap has widened since the last report, when men in Sonoma made $8,500 more than women. For all racial and ethnic groups except for Native Americans, men earn more than women.
- In Sonoma County, white residents earn over $15,000 more than Latino, Native American, and NHOPI residents.
- Among census tracts, median earnings range from $16,500 in the Rohnert Park B/C/R Section to $72,400 in East Bennett Valley (Santa Rosa).
In early 2022, the organizations that have spearheaded this project will lead a process of community engagement with a view to developing an Agenda for Action to guide the county’s collective work over the next five years. This agenda, once completed, will become part of this report.
SONOMA COUNTY HUMAN DEVELOPMENT REPORT 2014
RELEASED MAY 20, 2014
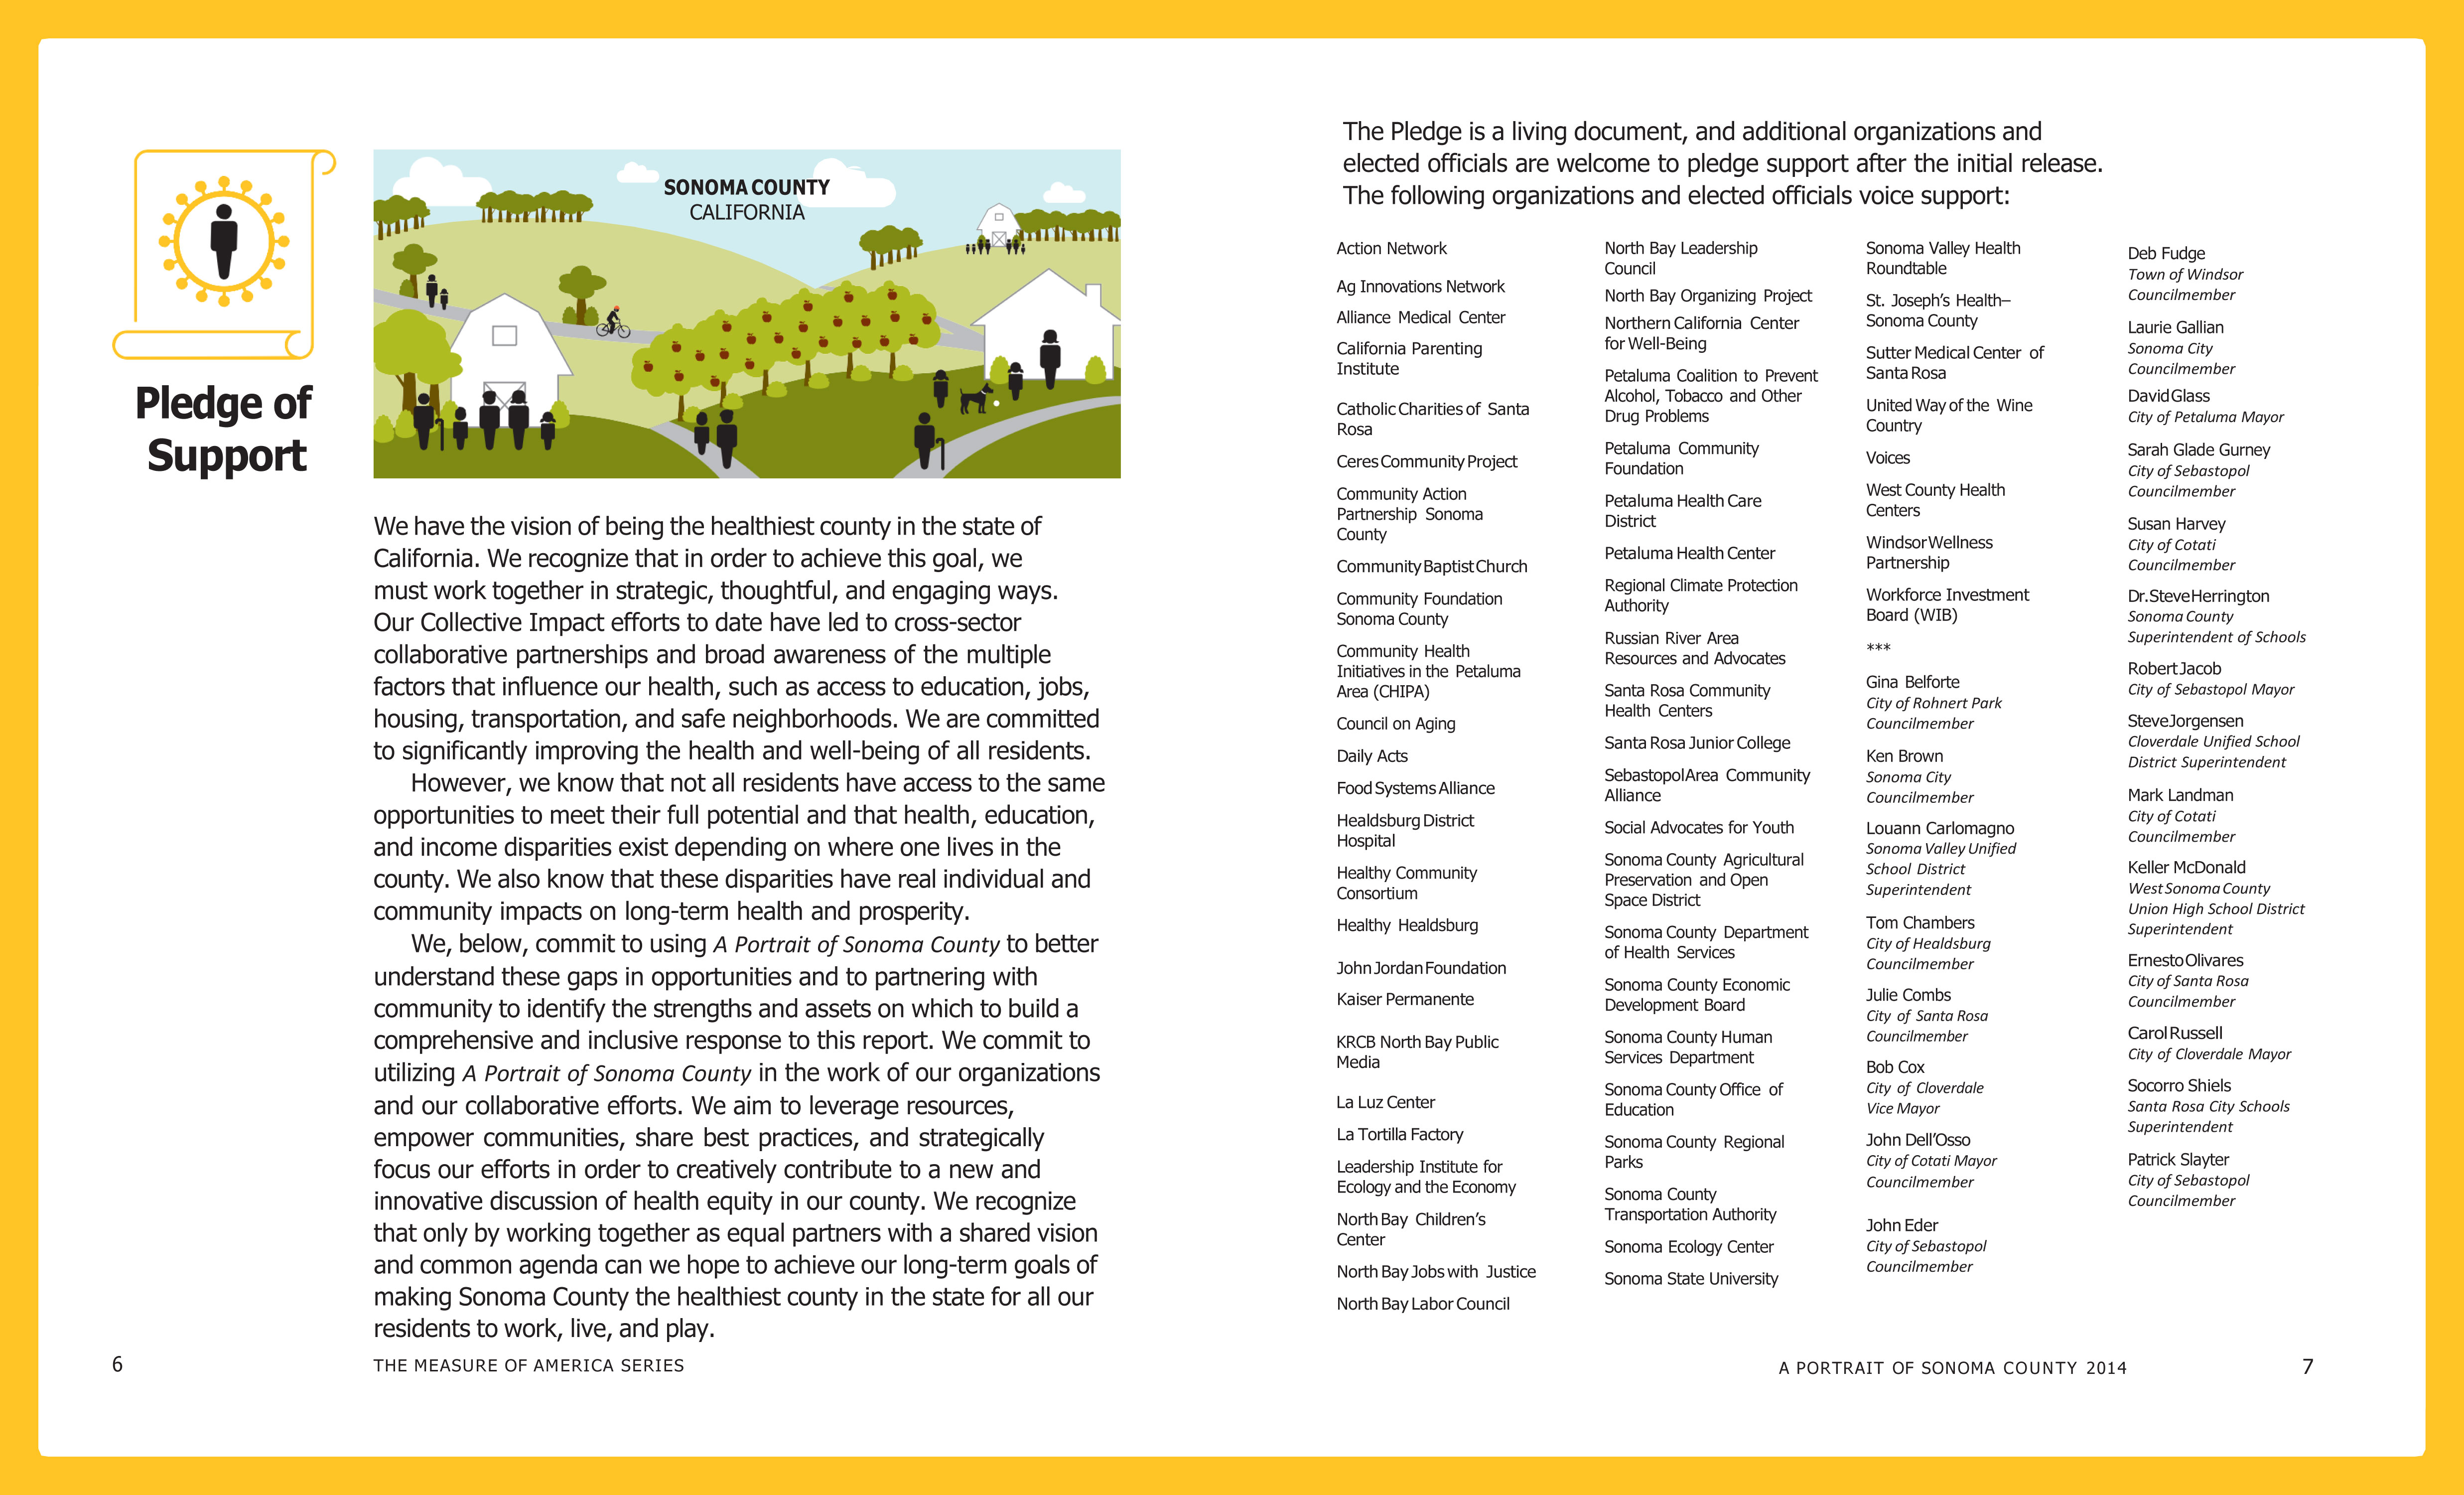
A Portrait of Sonoma County is an in-depth look at how residents of Sonoma County are faring in three fundamental areas of life: health, access to knowledge, and living standards. While these metrics do not measure the county’s breathtaking vistas, the rich diversity of its population, or the vibrant web of community organizations engaged in making it a better place, they capture outcomes in areas essential to well-being and opportunity.
 Commissioned by the County of Sonoma Department of Health Services (DHS), A Portrait of Sonoma County: Sonoma County Human Development Report 2014 is a collaborative effort in which the Measure of America team worked with local advocates in Sonoma County to better understand gaps in opportunities and build a comprehensive and inclusive response to the report. A Spanish translation is also available via this link: Un Retrato Del Condado De Sonoma.
Over sixty county leaders and community members have contributed to the final product, and these joint efforts have allowed stakeholders to lay the groundwork for quick action after the report’s release. Over ninety public and private sectors advocates have signed on to a Pledge of Support (see below) to address the challenges the report identifies. For anyone who is interested in signing the Pledge, please email: info@sonomahealthaction.org
________________________________________________________________________
________________________________________________________________________
For media and all other inquiries, contact us at: contact@measureofamerica.org.
A Portrait of Marin 2012
LAUNCHED JANUARY 2012
FULL REPORT [English] [Spanish] | MEDIA RELEASE| INTERACTIVE MAP
Commissioned by the Marin Community Foundation (MCF), A Portrait of Marin: Marin County Human Development Report 2012 was launched with a community conversation on January 18, 2012 in Marin, California. Donor and Advisory Panel
Read the Media Release
Explore Marin with Interactive Maps
The Way Forward
Download Data Set
A PORTRAIT OF MARIN: Marin County Human Development Report 2012
Some Marinites are enjoying extraordinarily high levels of well-being and access to opportunity, while others are experiencing levels of health, education, and standard of living that prevailed in the nation three decades ago. At the top of the rankings is Ross (HDI: 9.70), with the Canal area of San Rafael scoring the lowest (HDI: 3.18), below that of West Virginia, the lowest ranked state. Rankings are provided for the major racial and ethnic groups, men and women, and Marin’s fifty-one census tracts for which there are reliable U.S Census data.
SELECT FINDINGS:
Health:
- There is a 13-year gap in life span separating towns in Marin County. Residents of Ross have the longest lives (88 years), outliving residents of Hamilton in southern Novato (75.2 years) by 13 years.
- The average Ross resident lives nearly 8 years longer than the average Californian and an astonishing decade longer than the national average.
Education:
- While 88 percent of white children are enrolled in preschool, only 47 percent of Latino children are.
- While fewer than 30 percent of American adults have completed at least a four-year college degree, in Marin, over half have.
- In Marin, as across the nation, the schools whose students have greater needs tend to get fewer public dollars.
Income:
- The typical female worker living in Marin earns nearly $14,000 less per year than the typical male worker – a larger earnings gap than California ($10,217) and the overall national average ($11,179).
- Though Marin’s planners have targeted employment in areas such as biotechnology and software as a way to stimulate the recovery and the county’s long-term growth, the lion’s share of job growth that has occurred over the last two decades in Marin is overwhelmingly at the other end of the scale: low-wage service employment.
- The distribution of income in Marin is exceedingly lopsided; the top fifth of Marin taxpayers take home about 71 percent of the county’s total income. The bottom fifth earns 1.3 percent of the total income.
A Portrait of Marin highlights actions that Marinites can take to lock in human development successes today while setting the stage for significant budget savings and improved well-being tomorrow. These include creating an environment that reduces health risks; investing in preschool, and addressing the lower per-pupil spending in schools whose students have greatest needs; and expanding affordably priced housing to increase options for older adults and working families and to reduce Marin’s car congestion and pollution.
Visit our publications page for a complete list of national, state, county and thematic reports.
__________________________________________________________________________
For media and all other inquiries, contact us at: contact@measureofamerica.org | (718) 517-3720.