Measuring America: 10 Years and Counting
LAUNCHED DECEMBER 14TH, 2018 | MEDIA RELEASE
View the data story here.
Read the latest HDI Trends here. Read about our story here.
“Measuring America: 10 Years and Counting,” the latest update to the American Human Development Index by Measure of America (MOA) of the Social Science Research Council, moves beyond the overreliance on GDP as the primary measure of human progress and well-being in the U.S. MOA introduced the American Human Development Index in 2008, using official government data to create a composite rating of overall well-being based on health, education, and income, which enables comparisons over time and across race and ethnicity, place and gender. “Measuring America: 10 Years and Counting” explores trends in American Human Development Index scores over the past decade by race and ethnicity, gender, and U.S. state, revealing the uneven nature of America’s rebound from the 2007 financial crisis.
Highlights:
- The American Human Development Index for the United States as a whole is now 5.21, an increase of 6.4 percent over its score of 4.89, when it was first calculated in 2008.
- Women edge out men slightly, scoring 5.23 to men’s 5.20; women have better health and educational outcomes, but men earn more. When the Index was first calculated, men had a higher score than women.
- Education is the component of the Index that has improved the most over the last decade.
AMERICAN HUMAN DEVELOPMENT INDEX BY RACE/ ETHNICITY (Native American men are struggling, Latinos are soaring, with strong gains among black women, small improvement for white men)
- Asian residents have the highest score, followed by whites, Latinos, blacks, and Native Americans. In 2005, black residents had the lowest score; today, Native Americans do.
- Asians, the top-scoring group a decade ago, also have the highest well-being score today, 7.69.
- Asian men top the chart with a score of 7.82, followed by Asian women, with a score of 7.31.
- Whites have the second-highest score, 5.63. Whites also had the second-highest score in 2005.
- White men score 5.67, white women, 5.58. Although white men still outscore their female counterparts due to the former’s much higher wages, white women’s well-being has improved at a quicker clip over the past decade.
- White women’s score improved by 10.5 percent, but white men’s score improved by just 3.27 percent—the smallest improvement of any group except for Native American men, whose score actually decreased. So while white men still rank third on the well-being chart—after Asian men and Asian women—the gap between them and white women, black men, black women, Latino men, Latina women, and Native American women has narrowed since 2005.
- Latinos rank third overall, with a score of 4.59. Latinas have a higher score than their male counterparts, 4.65 compared to 4.37.
- Blacks rank fourth on the national list with a score of 4.02. The well-being scores of black women and men diverge more than those of any other racial and ethnic group; black women score 4.49 and black men score 3.57.
- Black women have seen some of the largest well-being gains over the past decade. Their score has increased by 17.5 percent since 2005; only Latinos made faster progress. Black men’s score has also improved, but by much less, 7.1 percent.
- Native Americans have the lowest score of the country’s major racial and ethnic groups, 3.69. As with black residents, Native Americans see a sharp gender divide. Native American women score 4.00, Native American men, 3.29.
- While women’s score has increased by 9.5 percent over the last decade, outpacing national improvements, Native American men’s score declined by 7.9 percent since 2005. They are the only group whose well-being score fell over the last decade.
- Native American men (3.29) and black men (3.57) have well-being scores similar to those that prevailed in the US in the late 1960s.
HEALTH (18-year life expectancy gap between Asian women and black men)
- Life expectancy in the US is now 79.4 years, an increase of 1.6 years since 2005.
- American women outlive American men by five years—81.9 as compared to 76.8.
- Asian women enjoy the longest lives by a huge margin; their life expectancy is an astonishing 90.5 years.
- An Asian baby girl born in the United States today can expect to live 17.8 years longer than a black baby boy born in the United States today, the largest life expectancy gap by race/ethnicity and gender.
- White men (76.6), Native American men (73.4), and black men (72.7 years) have the shortest lives.
EDUCATION (Strong gains among women, Latinos)
- For the nation, the Education Index score increased over half a point, from 4.70 in 2005 to 5.24 in 2016, an 11.6 percent increase.
- Both women and men’s scores improved over the past decade, but women’s scores increased twice as fast.
- Women ages 25 and up have become slightly more likely than their male counterparts to have graduated high school and earned bachelor’s and graduate degrees. Girls and young women are now also slightly more likely to be enrolled in school than boys and young men.
- Among racial and ethnic groups, Asians have the highest Education Index score overall, 7.33. This represents an increase from their 2005 score of 6.72. Asian men outperform Asian women in education, scoring 7.62 as compared to 7.10. Asians are the only group in which men have higher education scores than women. More than half of Asian adults have at least a four-year bachelor’s degree.
- Although Latinos still have the lowest education scores among the major racial and ethnic groups they have made astonishing progress over the last decade. Their score increased by 45.4 percent, four times greater than the increase in the national score.
INCOME (Only component of the Index to decrease; white women experience biggest gain)
- Median personal earnings is the only component of the Index to have decreased nationwide over the last ten years.
- US median earnings were $33,288 in 2005 (converted to 2016 dollars) and $32,024 in 2016.
- In every racial and ethnic group, men earn more than women, though the size of the gap varies.
- White women saw an earnings gain of $2,042, the largest boost of any race-gender combination.
- Asian men’s earnings increased by $1,784, Latina women’s by $1,016, and Latino men by $620.
- Black women saw their wages decline by $364, and white men saw theirs drop by $1,544.
- The greatest wage declines, more than $3,300, were experienced by Native American and black men.
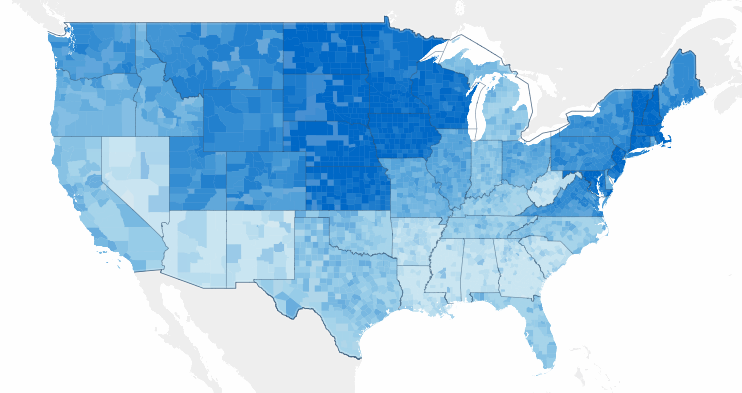
AMERICAN HUMAN DEVELOPMENT INDEX BY STATE (The Northeast is faring the best, Southern states are struggling)
- Today, the highest American Human Development Index scores are found in Washington, DC (6.92), Massachusetts (6.36), and Connecticut (6.31).
- The lowest scores are found in Arkansas (4.17), Mississippi (4.05), and West Virginia (3.94).
- The greatest increases in American HD Index scores occurred in Washington, DC, Wyoming, South Dakota, Louisiana, and Mississippi. Curiously, this list includes both Washington, DC, which ranks first in the country, and Mississippi, which ranked last a decade ago and ranks fiftieth today.
- Generally speaking, states in the Northeast are faring the best, while Southern states are struggling.
- Most states are better off today than they were a decade ago; Washington, DC, and 44 states saw increases in their HD Index scores.
- Six states saw no significant change in their HD Index scores: Michigan, Alaska, West Virginia, New Hampshire, Vermont, and Rhode Island.
“The decade following the Great Recession was the LatinX decade, with American Human Development Index gains among Latinas and Latinos outpacing all others,” said Kristen Lewis, director of Measure of America. “Measuring America: 10 Years and Counting” reveals that certain groups and places are surging ahead in terms of health, education, and income, the building blocks of a freely chosen life of opportunity and well-being, while others are treading water or falling further behind. These growing gaps in well-being are extremely costly to the U.S. as a whole, hurting our global economic competitiveness and cutting off opportunities for people to develop the capabilities they need to seize opportunities and that we will need as a country to meet the challenges of the global information economy.”
Reflections from our Stakeholders
“The American Human Development Index enables businesses, government, philanthropy and scholars to track inequality by gender, or race and ethnicity, illuminating areas for intervention and areas of improvement, analytic insights that can help everyone prosper. Measuring America: 10 Years and Counting mobilizes social science for the public good, which is the mission of the Council.”
—Alondra Nelson, President, Social Science Research Council
“SSRC’s 10th anniversary ‘Measuring America’ report reveals both the need and power of intersectional analyses. We can no longer simply talk in blanket terms about race, ethnicity, class, gender and region since the American Human Index informs us that overall well-being varies at the intersections of multiple identities. The good news is that on average, some people’s lives are improving significantly. The regrettable news is that circumstances are still quite challenging for many others. Our society has much work to do to improve the welfare of its entire populace still; and this informative report provides some direction and necessary considerations.”
—Dr. Prudence Carter, Dean, Graduate School of Education at UC Berkeley
“A Portrait of New York City paints a rich portrait of a greater metropolis that is, on the whole, thriving, diverse, and befitting of its title as a global city. At the same time, the report reveals differences in human development by micro-location that sometimes rival those between nation-states. Luckily, it also offers a plan of action to improve the outcomes of all New Yorkers while reducing disparities.”
—Dalton Conley, the Henry Putnam University Professor in Sociology at Princeton University
“As an executive steering committee member to the 100,000 Opportunities Initiative, we have seen how the coalition has benefited from using Measure of America’s data on opportunity youth to inform and focus our efforts in cities, communities, and zip codes facing significant youth disconnections rates. We know that we, alongside our collaborators in the 100,000 Opportunities Initiative, have been able to focus our resources and make a significant difference in connecting opportunity youth to employment opportunities with the help of Measure of America’s rigorous research and rich data.”
—Virginia Tenpenny, VP, Starbucks Global Social Impact, Executive Steering Committee member, 100,000 Opportunities Initiative
“This newer and smarter way of measuring well-being will allow us to understand how income, health and education all intersect to contribute to whether you and your community experience well-being or live at a great disadvantage. We knew there were grave disparities across the County, but now [with A Portrait of Los Angeles County] we have a more reliable way of geographically pinpointing the areas of greatest need.”
—Sheila Kuehl, LA County Supervisor and Board of Supervisors Chair
“A Portrait of New York City is exactly the type of local data-driven research that policy-makers and Community Board members need in order to make sense of complex demographic trends and make informed decisions to improve the life prospects of all New York City residents.”
—Gale A. Brewer, Manhattan Borough President
“Ten years ago, as then Counsel to Wisconsin Senator Russ Feingold, I was first introduced to the first Measure of America National Report. I was intrigued and grateful then, as I am now, with the compilation of information that underpinned the state of our society with statistics that mattered. Information that accurately tells the stories about our health, education and well-being matter the most to us as policy makers and grant makers as we seek to steer resources to measurably improve the lives of our communities and our nation. The Measure of America continues to be a go to resource for every US policy and grant maker.”
—Christopher G. Oechsli, President & CEO, The Atlantic Philanthropies
“We knew the goal of our Reconnecting Youth Campaign – increasing federal funding for Opportunity Youth to provide one million reconnection opportunities per year—would be hard to achieve. So when we learned from the Congressional Management Foundation that 91 percent of congressional staff say it is helpful for advocacy organizations to give members of congress information about the impact that a bill would have on their district and state, yet only 9 percent say they frequently receive such information, we saw an opportunity to stand out from the crowd. Using data from Measure of America on the number of opportunity youth in each congressional district, we were able to provide members of congress detailed information about how increased funding would help young people in their specific district. The results: compared to FY17 levels, Congress invested $121M more in FY18 and $228M more in FY19. We, and the opportunity youth served, owe Measure of America a debt of gratitude for the important role they played in our campaign.”
—Thaddeus Ferber, VP, Forum for Youth Investment
“[A Portrait of New York City] from Measure of America brilliantly articulates the stark, profound, and disparate realities faced by New Yorkers depending on race, ethnicity, and neighborhood. The report also helps us understand that in order to have a New York City we can all be proud of we must work strategically and collectively to solve our most urgent problems.”
—Sheena Wright, President & CEO, United Way of New York City
“‘Two Futures’ brings into focus the long-term struggles of a segment of the population that hasn’t received nearly enough attention: young people who lose a connection to two core institutions, the education system and the labor market, in the period of early adulthood. The report provides a warning signal that if we don’t pay closer attention to this crucial period of the life course the consequences of disconnection can linger on for decades.”
—Patrick Sharkey, Professor, Chair of Sociology Department New York University
Measuring America: 10 Years and Counting was made possible by the generous support of the Conrad N. Hilton Foundation.
Geographies of Opportunity
LAUNCHED APRIL 22, 2015
FULL REPORT | MAP THE DATA | MEDIA RELEASE
 Geographies of Opportunity: Ranking Well-Being by Congressional District is an in-depth look at how residents of America’s 436 congressional districts are faring in three fundamental areas of life: health, access to knowledge, and living standards. While these metrics do not measure every aspect of our multifaceted society, they capture outcomes that are essential to well-being and opportunity. The hallmark of this work is the American Human Development Index, a supplement to GDP and other money metrics that tells the story of how ordinary Americans are faring. For more on the index, go here.
KEY FINDINGS: AMERICAN HUMAN DEVELOPMENT INDEX
- The top ten congressional districts in terms of human development (HD) are all in the greater metropolitan areas of LA, NYC, San Francisco, and DC.
- The bottom ten districts disproportionately comprise struggling rural and urban areas in the South. These areas face interlocking challenges in terms of residential segregation by income and race, poor health, under-resourced educational infrastructure, and limited job opportunities.
- In the 22 congressional districts where almost all residents (98 percent or more) are native-born, American Human Development Index scores are all below the national average.
[layerslider id=”8″]
KEY FINDINGS: HEALTH
- Life expectancy ranges from just under 84 years in California District 19 (San Jose and part of Santa Clara County) to just under 73 years in Kentucky District 5 (rural southeastern Kentucky). This shocking gap is more extreme than the life expectancy difference between Japan and the Palestinian territories.
- African Americans fare particularly poorly on health indicators. Whites outlive African Americans by 3.6 years; African Americans have higher death rates from a variety of causes, chief among them heart disease, cancer, homicide, diabetes, and infant death.
- The higher the proportion of foreign-born residents in a congressional district, the longer the district’s life expectancy.
KEY FINDINGS: EDUCATION
- Topping the charts in education are districts from the San Francisco, Boston, New York, Los Angeles, and Washington, DC, metro areas. They occupy this rarefied position for two primary reasons: these cities attract highly educated workers from elsewhere and support (with some notable exceptions) their youth with robust pathways to high school and college completion.
- There are over 5.5 million disconnected youth in the United States—young people between the ages of 16 and 24 who are out of work and out of school. In 32 districts, at least one in every five youth are disconnected. These districts are concentrated in the South and Southwest.
KEY FINDINGS: STANDARD OF LIVING
- Median personal earnings by congressional district range from about $20,000 in the highly diverse LA neighborhoods of California District 34 to more than triple that sum (nearly $61,000) in New York District 12 (Manhattan’s East Side and parts of Brooklyn and Queens). The distribution of earnings between these two extremes is heavily skewed toward the lower end; in over half of all districts (222 out of 436), median personal earnings fall between $20,000 and $30,000.
- Pockets of high and low earnings are found in every part of the country. The greatest earnings inequality is in the Middle Atlantic region—home to both the storied glamor of the top-earning Upper East Side of Manhattan and, just five subway stops away, the entrenched poverty of the South Bronx neighborhoods that make up District 15, which has the fourth-lowest earnings in the nations.
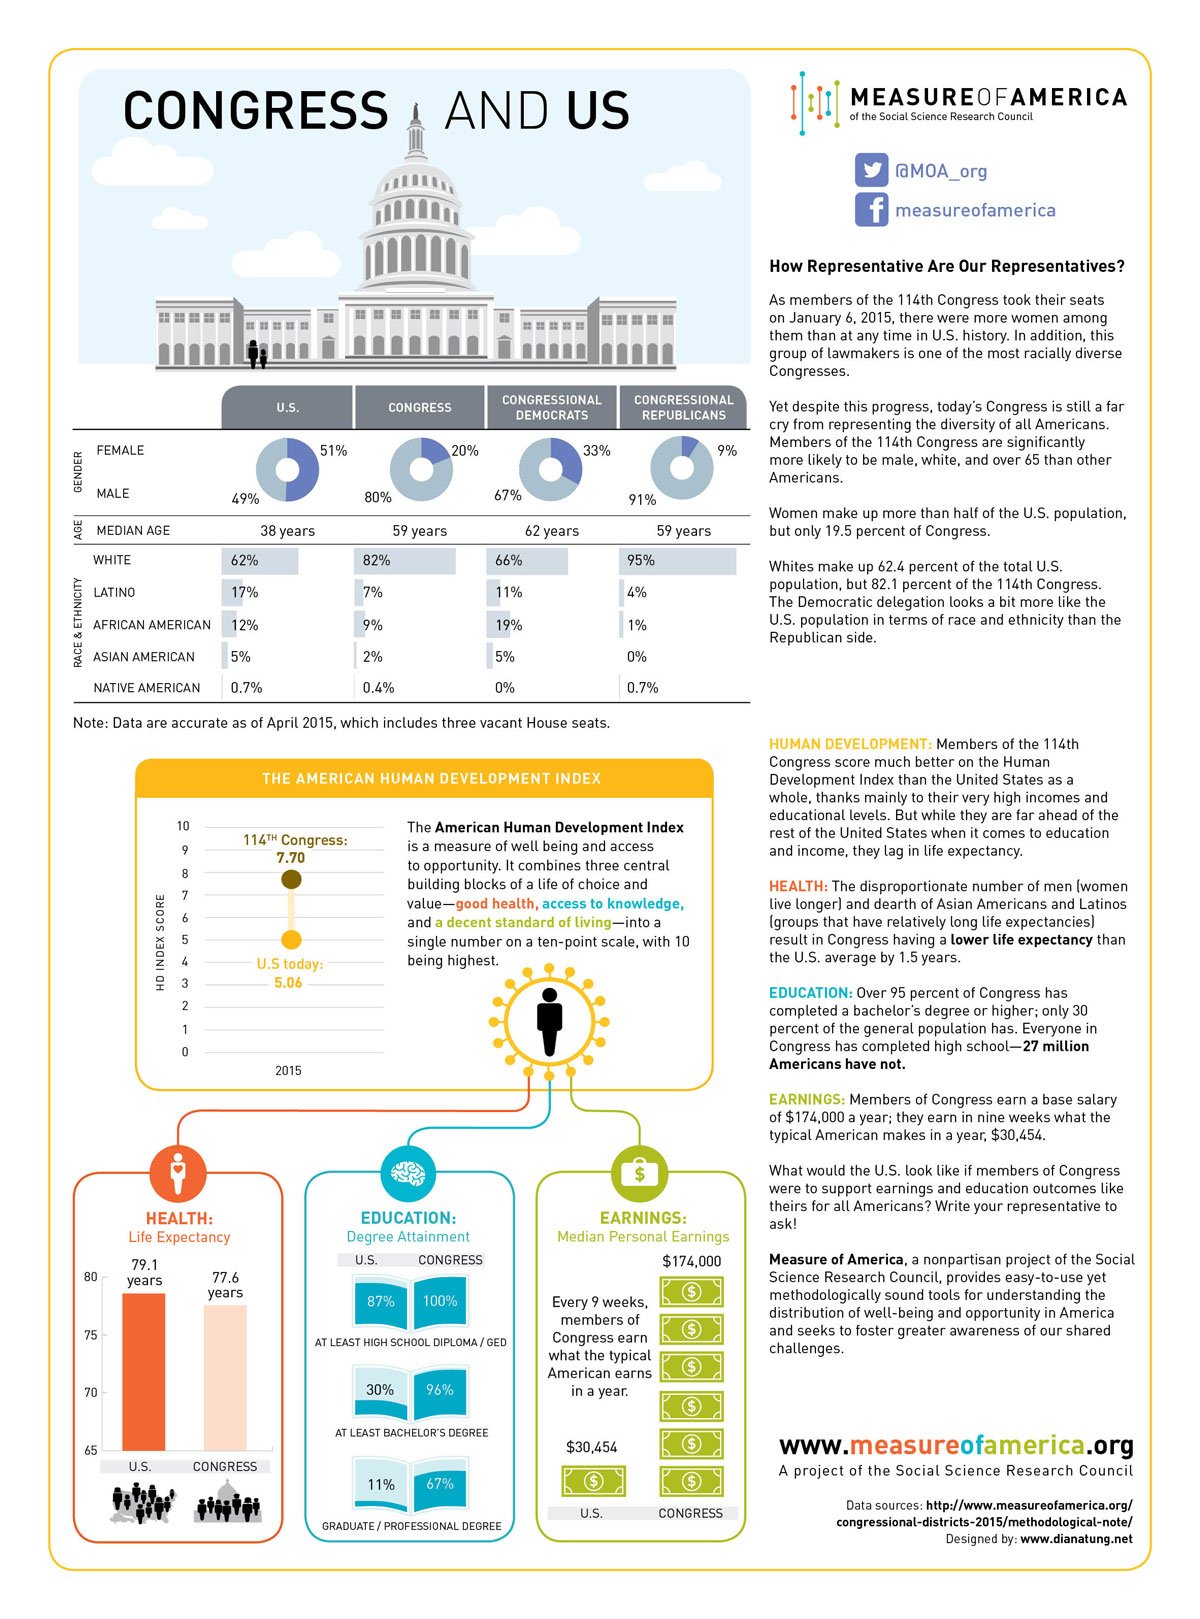
Members of Congress as a group tend to have much higher levels of human development than the people they represent. The graphic below shows how the 114th Congress compares to the U.S. population on the American Human Development Index.
2013 Opportunity Index
The Opportunity Index was unveiled in September 2011, ranking every state and over 2,400 counties. The updated 2013 Opportunity Index, which was launched in November 2013, reflects the status of opportunity in America now and offers comparisons with the last two years.
Some new findings of the 2013 Opportunity Index were:
- 26 states and Washington, D.C. improved their Opportunity Scores
- Unemployment rates declined, but 49 states saw an increase of those living below the poverty line
- 46 states experienced a drop in median household income in 2013, and income inequality increased in 39 states over three years
- Internet access improved in all 50 states and Washington, D.C. – yet 19 million Americans still lack internet access
- 44 states saw a decrease in violent crime
About the Opportunity Index:
Geography should not determine destiny, but the sad reality is that for many Americans where you live has tangible effects on your ability to climb the ladder of opportunity. Restoring this key part of the American dream requires action, and action requires knowing where we stand. Analysis of the quilt of economic opportunity and upward mobility in America can reveal where the American dream thrives – and where it struggles.
In order to measure community opportunity, Measure of America and Opportunity Nation jointly developed the Opportunity Index, an interactive online tool. Focusing on three key dimensions, the Opportunity Index is a unique tool designed to provide a snapshot of what opportunity looks like in our communities.
The Index is designed to connect economic, educational, civic and community factors together to help identify obstacles to opportunity and mobility – and develop concrete solutions. This tool is needed since GDP and unemployment rates do not give the whole picture of opportunity; the Index reveals the interconnected conditions in American communities that impact upward mobility and access to opportunity.
__________________________________________________________________________
For media and all other inquiries, contact Eric J. Henderson: eric@measureofamerica.org | (718) 517-3606.
For more tailored products and services, please visit our Services page.
The Measure of America 2013–2014
LAUNCHED JUNE 19, 2013
FULL REPORT | INTERACTIVE MAP | MEDIA RELEASE
 In the era of “big data,” it would seem that policymakers and regular people alike would have the information they need at their fingertips to understand their world and make it better. Unfortunately, that’s far from the case. Though we know the country’s gross domestic product quarterly, its retail sales monthly, and stock market numbers minute-by-minute, we rarely hear statistics on our country’s people.
How long can a baby born today in Missouri, New Mexico, or Minnesota expect to live? What proportion of adults have completed high school in Houston as compared to Dallas? What wages and salaries are typical of Latinos in the United States, and how do they compare to those of whites or African Americans?
Measure of America’s mission is to use data points like these to tell the story of how people—not just the economy—are doing. We do so using the global gold standard for measuring well-being and access to opportunity: the Human Development Index.
This third volume in the Measure of America series measures well-being in three vital areas—health, education, and earnings—that shape the opportunities available to us and enable people to invest in their families and live to their full potential. The Measure of America 2013–2014 contains American Human Development Index ranking for the 50 U.S. states, the 25 largest metropolitan areas, and racial and ethnic groups within those states and metro areas. It also looks at changes in well-being in states since 2000 and in metro areas before and after the Great Recession.
Among the key findings of The Measure of America 2013-2014:
CHANGE OVER TIME
- Michigan, the only state with a 2010 American HD Index score lower than its 2000 score, saw the greatest decline in human development over the past decade.
- While the Great Recession undoubtedly pulled wages downward, the trend in declining earnings started before the financial collapse. From 2000 to 2005, wages stalled or declined in thirty-nine states after four decades of slow but steady national progress in earnings.
- Resources like natural gas enabled states such as New Mexico, Montana, and West Virginia to avoid the earnings losses most other states faced between 2000 and 2010. But their HD Index rankings remained low; valuable natural resources do not automatically fuel improvements in people’s well-being.
- Of the five major U.S. racial and ethnic groups, African Americans saw the greatest increase in life expectancy, nearly three years. However, African Americans started from the lowest point and still have the shortest life spans. Native Americans were the only racial or ethnic group whose life expectancy did not increase between 2000 and 2010.
- The five metro areas whose Index scores increased the most from 2008 to 2010, Baltimore, Washington, D.C., San Antonio, Dallas, and Boston, did so largely on the strength of improvements in health. San Antonio, although it ranked last in 2008 and second-to-last in 2010, is gaining ground comparatively quickly.
- The only five metro areas whose American Human Development Index scores declined from 2008 to 2010 were Detroit, Portland, Atlanta, Miami, and Tampa-the same cities that lost the most ground in terms of earnings over that period.
RACE AND ETHNICITY
- The top-scoring racial/ethnic group on the American HD Index is Asian Americans (7.21), followed by whites (5.43), Latinos (4.05), African Americans (3.81), and Native Americans (3.55).
- Asian Americans score highest in each of the three components of the Index: at the national level, they live the longest, have the most education, and earn the most.
- Latinos have the second-longest life span, outliving whites, on average, by nearly four years.
- African Americans have the shortest lives, but their educational outcomes and earnings exceed those of both Latinos and Native Americans.
U.S. STATES
- The top five states on the American HD Index are Connecticut, Massachusetts, New Jersey, the District of Columbia, and Maryland.
- The bottom five states are Alabama, Kentucky, West Virginia, Arkansas, and Mississippi.
- Residents of Mississippi have life spans and earnings on par with those of the typical American in the late 1980s.
- In no state do African Americans or Latinos have well-being levels above those of whites or Asian Americans.
TWENTY-FIVE LARGEST METROPOLITAN AREAS
- The metro areas that perform best on the American HD Index are, starting from the top: Washington, D.C., San Francisco, Boston, Minneapolis-St. Paul, and New York. Workers in the top-ranked Washington, D.C. metro area make over $14,000 more than the typical American wage-earner, are more than twice as likely to have a graduate degree as other Americans, and live 2.2 years longer.
- The metro areas with the lowest levels of well-being are Detroit, Houston, Tampa, San Antonio, and, in last place, Riverside-San Bernardino. In Riverside-San Bernardino, one in five adults 25 and older never completed high school. Earnings are about $2,000 less per year than the national median.
- Consistent with the state-level analysis, in no major U.S. metropolitan area do either African Americans or Latinos have well-being levels that equal or exceed those of Asian Americans or whites.
This report was made possible by the generous support of the Conrad N. Hilton Foundation.
__________________________________________________________________________
For media and all other inquiries, contact us at: contact@measureofamerica.org.
State of the Congress 2013
LAUNCHED JANUARY 2013
 The 113th Congress is the most diverse group of representatives in history. Yet its members are still significantly more likely to be male, white, and over 65 than other Americans.[i] And in terms of basic well-being and access to opportunity, members of Congress are far ahead of the average in earnings and education but lag in life expectancy.
How representative are our representatives?
- HUMAN DEVELOPMENT: Members of the 113th Congress score better on the American Human Development Index than people from the top-ranked U.S. state, Connecticut—7.68 out of 10.[ii]
The American Human Development Index is a measure of well-being that combines three central building blocks of a life of choice and value—health, education, and earnings.
- HEALTH: The average American can expect to outlive the average member of the 113th Congress by more than one and a half years.[iii] The disproportionate number of men (the world over, women live longer) and dearth of Asian Americans and Latinos, the racial and ethnic groups that live the longest, pull down the average Congressional life span.
- EDUCATION: Over 95 percent of members of Congress have completed a bachelor’s degree or higher; only 28 percent of the general population has.[iv] While 0.6 percent of the U.S. adult population are lawyers, 41 percent of the 113th Congress are. Members of Congress are sixty-eight times as likely as all American adults to have practiced law.[v]
- EARNINGS: Median annual earnings, the typical wages and salaries of American workers ages 16 and older, are $29,000. Median earnings for members of Congress are $174,000. All Representatives and Senators earn this amount except for the Speaker of the House, President of the Senate, and majority/minority leaders of the House and Senate. These figures include only salaries, not outside income, assets, allowances or benefits.[vi] Put another way, members of Congress earn six times what the typical worker earns annually.
__________________________________________________________________________
For media and all other inquiries,contact us at: contact@measureofamerica.org | (718) 517-3720.
[i] National demographic characteristics are from the U.S. Census Bureau, Vintage 2011 postcensal population estimates. Demographic characteristics of the 113th Congress were derived from official member websites (see directory of House of Representatives’ official websites and directory of Senators’ official websites and the House Press Gallery, 2012 House Election Results website). Totals do not sum to 100 percent for two reasons: 1. rounding; and 2. the population of other groups, such as Native Hawaiians and other Pacific Islanders, are extremely small.
[ii] The American Human Development Index (AHDI) value for the U.S. population is from The Measure of America 2013 (forthcoming). For the 113th Congress, the Index was calculated by Measure of America using the following sources:
LIFE EXPECTANCY: corresponds to the estimate of the gender and racial or ethnic group to which the member belongs for the state the member represents based on Measure of America calculations. Life expectancy for the 113th Congress is the average of the life expectancy estimates for all sitting Members of the 113th Congress.
EDUCATIONAL ENROLLMENT: Assumed to be the same as the value for the nation. For further details, see the Index Methodological Note. Please note however that Measure of America now calculates educational enrollment as the ratio of enrolled students ages 3 to 24 to the total student-age population ages 3 to 24.
EDUCATIONAL ATTAINMENT: Degree attainment of each member. See note iv below for data sources.
EARNINGS: Median Congressional earnings of members of the 113th Congress. See note vi below for data source.
[iii] Measure of America calculations using mortality data from the Centers for Disease Control and Prevention, National Center for Health Statistics and intercensal population estimates from the U.S. Census Bureau in collaboration with the National Center for Health Statistics (NCHS) through the CDC-WONDER on-line database. Estimates are for 2009.
[iv] Educational attainment figures for the U.S. adult population are from the U.S. Census Bureau, American Community Survey 2010. The educational attainment of members of the 113th Congress was compiled from official member websites reference above, from annual New Member Pictorial Directories, from the Washington Times and Washington Post candidate profiles and from the graduation records of colleges and universities attended by sitting members. Honorary degrees were not included.
[v] Licensed lawyers as a percentage of the adult population 25 and older in the U.S. is from the American Bar Association, “Lawyer Demographics 2012.” Licensed lawyers in the 113th Congress was compiled by Measure of America from sources including: official member websites referenced above, the U.S. House of Representatives Office of the Clerk, “Lawyers in the U.S. House of Representatives,” and New Member Pictorial Directories.
[vi] Median personal earnings for the working-age population with earnings are from the U.S. Census Bureau American Community Survey 2010. Median Congressional earnings for the 113th Congress are from Brudnick, I. (2012) “Salaries of Members of Congress: Recent Actions and Historical Tables,” Congressional Research Service.
The Measure of America 2010-2011: Mapping Risks and Resilience
LAUNCHED NOVEMBER 10, 2010 | MEDIA RELEASE
 Highlights:
-
-
- Whites in Washington, DC, live, on average, twelve years longer than African Americans in the same city.
- In the 2007–9 Great Recession, college graduates faced an un- and underemployment rate of 1 in 10; the rate for high school dropouts was greater than 1 in 3.
- In no U.S. states do African Americans, Latinos, or Native Americans earn more than Asian Americans or whites.
-
These startling facts are just some of the issues covered in The Measure of America 2010-2011. With a foreword by Jeffrey D. Sachs, the second volume in The Measure of America series is an easy-to-understand guide to where different groups stand today, and why. The book contains American Human Development Index ranking for all 50 states, 435 congressional districts, major metropolitan areas, racial and ethnic groups, as well as men and women. It concludes with a set of recommendations for priority actions required to improve scores on the Index across the board and to close the stark gaps that separate groups.
The Measure of America 2010-2011 also shines a spotlight on risks to progress and opportunity, and identifies tested approaches to fostering resilience among different groups: Who is most at risk for obesity? How can workers secure better footholds in the job market? How important is early childhood education? This report provides the tools necessary to build upon past policy successes, protect the progress made over the last half century from emerging risks, and develop an infrastructure of opportunity that can serve a new generation of Americans.
Order from NYUP | Kindle edition
Download PDFs:
Media Release
AHDP Health Fact Sheet
AHDP Education Fact Sheet
AHDP Standard of Living Fact Sheet
FAQs
Quick Facts from the book
Selected extracts from the book:
Table of Contents
Foreword
Introduction
Key Findings
Agenda for Action
Methodological Notes
__________________________________________________________________________
For media and all other inquiries, contact us at: contact@measureofamerica.org.