Zeroing In on Place and Race
To see the most recent data, check out our interactive tool on youth disconnection.
LAUNCHED JUNE 10, 2015
FULL REPORT | INTERACTIVE TOOL | MEDIA RELEASE
 Zeroing In on Place and Race is an in-depth look at how disconnected youth are faring in America’s cities, with data included on disconnected youth by state, congressional district, county, gender, and by race and ethnicity. Disconnected youth are teenagers and young adults between the ages of 16 and 24 who are neither working nor in school. There are 5,527,000 disconnected youth in America today, or one in seven young adults (13.8 percent)—about as many people as live in Minnesota. The national disconnected youth population is larger than the populations of thirty US states.
KEY FINDINGS
- The rate of youth disconnection has fallen since the Great Recession. Roughly 280,000 fewer young people are disconnected today than in 2010, the peak year for youth disconnection during the last decade. Beneath the national rate of 13.8 percent, however, lies staggering variation.
- Of the ninety-eight major metro areas included in this report—home to two in three Americans— disconnection rates range from under 8 percent in the Omaha, Nebraska, and Bridgeport, Connecticut, metro areas to over 20 percent in greater Lakeland, Florida; Bakersfield, California; and Memphis, Tennessee.
[layerslider id=”ZPAR”]
- At the national level, youth disconnection rates for blacks (21.6 percent), Native Americans (27.8 percent), and Latinos (16.3 percent) are markedly higher than rates for Asian Americans (7.9 percent) or whites (11.3 percent). In nine metro areas, at least one in four black youth are disconnected. In ten metro areas, at least one in five Latino youth are disconnected.
- The negative effects of youth disconnection ricochet across the economy, the social sector, the criminal justice system, and the political landscape, affecting all of us. Our analysis of a very small subset of the direct costs of youth disconnection reveals an astonishingly high cost to taxpayers: $26.8 billion in 2013 alone, or nearly the entire amount the federal government spends on science.
- Although national patterns are generally mirrored in metro areas, important variation exists. For instance, a city can simultaneously be among the best for one racial or ethnic group and among the worst for another. The greater Boston metro area, which has a low overall disconnection rate (8.2 percent), is relatively good for white (6.8 percent) and black youth (9.8 percent), but not for Latinos (17.3 percent). In the Chicago metro area, both whites and Latinos are doing better than they are in the country as a whole (7.5 and 13.9 percent, respectively), but blacks are doing much worse (24.5 percent).
- New research for this report shows that racial segregation has dramatic but very different consequences for young people depending on their race. Our research shows that in highly segregated metro areas, black youth tend to have higher-than-average rates of disconnection, whereas white youth tend to have lower-than average rates of disconnection. In other words, residential segregation by race disproportionately harms black teenagers and young adults.
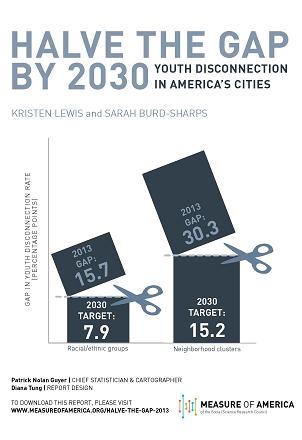
HALVE THE GAP BY 2030: Youth Disconnection in America’s Cities
To see the most recent data, check out our interactive tool on youth disconnection.
LAUNCHED OCTOBER 24, 2013
FULL REPORT | INTERACTIVE TOOL | MEDIA RELEASE
Once again, the back-to-school season has come and gone. High school and college students have settled into new routines, and recent grads have moved on to new roles. But an astounding 5.8 million teens and young adults between the ages of 16 and 24 are neither working nor in school. As their peers lay the foundation for a productive and meaningful adulthood, these disconnected youth find themselves unmoored from the structures that confer knowledge, skills, identity, and purpose.
Just over a year ago, Measure of America published its initial research on the epidemic of youth disconnection called One in Seven. This report updates last year’s findings with the latest numbers and, to better map the landscape of youth disconnection, also presents the data by neighborhood cluster for each of the twenty-five most populous US metro areas.
Key findings include the following:
- Boston (9.2 percent), Minneapolis (9.5 percent), and Washington, DC (11.3 percent) have the lowest rates of youth disconnection among the twenty-five most populous metro areas.
- Charlotte (17.3 percent), Detroit (17.4 percent), and Riverside–San Bernardino (18.8 percent) are home to the greatest share of disconnected young people.
- The greatest disparities are found not between but within our nation’s big cities. In Chicago, New York, and Detroit, gaps of approximately 30 percentage points separate the most- and least-connected neighborhood clusters.
- A chasm separates different racial and ethnic groups. In Pittsburgh and St. Louis, one in every four African American young people is disconnected, compared to one in every ten white youth. Nationwide, African Americans are roughly three times as likely as Asian Americans and twice as likely as whites to be disconnected in their teens and early twenties.
In addition to painting a picture of youth disconnection in America today, in this report we imagine, in very specific terms, a different, better tomorrow. We lay out an ambitious but attainable goal: to halve the gaps between the most- and least-connected neighborhoods and between racial groups in half by 2030. Our research has convinced us that, through the collective efforts of educational institutions, social service delivery organizations, the justice system, the private and nonprofit sectors, and others, this objective is within reach. By coalescing around a shared goal, we can galvanize greater attention to the problem, mobilize more resources, and put in place a system of accountability for tracking our progress annually.
What would it mean in practice to halve the gap? In Philadelphia, the African American youth disconnection rate is 25.2 percent, and the white rate is 8.9 percent, a gap of 16.3 percentage points; halving the racial gap would mean that no more than 8.15 percentage points would separate blacks and whites by 2030. In terms of Philly neighborhoods, the highest youth disconnection rate is 30 percent, the lowest, 3.2 percent, a gap of 26.8 percentage points; halving the neighborhood gap would mean no more than 13.4 percentage points would separate any two neighborhoods by 2030.
We firmly believe that setting measurable, time-bound targets for reducing youth disconnection is key to moving the needle on this critical issue. Knowing where you want to go is fundamental to getting there.
__________________________________________________________________________
For media and all other inquiries, contact us at: contact@measureofamerica.org.
One in Seven
One in Seven: Ranking Youth Disconnection in the 25 Largest Metro Areas
To see the most recent data, check out our interactive tool on youth disconnection.
LAUNCHED SEPTEMBER 13, 2012
FULL REPORT | INTERACTIVE TOOL | MEDIA RELEASE
 What’s new in this report?
An astonishing one in every seven Americans ages 16 to 24 is neither working nor in school—5.8 million young people in all. As their peers lay the foundation for a productive, fulfilling adulthood, these disconnected youth find themselves adrift at society’s margins, unmoored from the structures that confer knowledge, skills, identity, and purpose.
The cost is high for affected individuals—and for society as a whole. Lack of attachment to the anchor institutions of school or work at this stage of life can leave scars that last a lifetime, affecting everything from earnings and financial independence to physical and mental health and even marital prospects. And last year alone, youth disconnection cost taxpayers $93.7 billion in government support and lost tax revenue.
This brief ranks the country’s 25 largest metropolitan areas as well as the nation’s largest racial and ethnic groups in terms of youth disconnection. Key findings include the following:
- Big gaps separate major metro areas; in bottom-ranked Phoenix, 19 percent of young people are disconnected from the worlds of work and school, whereas in Boston, which tops the chart, only about 9 percent are.
- African American young people have the highest rate of youth disconnection, 22.5 percent nationally. In Pittsburgh, Seattle, Detroit, and Phoenix, more than one in four African American young people are disconnected.
- Young men are slightly more likely to be disconnected than young women, a reversal of the situation found in decades past. The situation varies by race and ethnicity, however. The gender gap is largest among African Americans; nationally, 26 percent of African American male youth are disconnected, compared to 19 percent of their female counterparts.
- Youth disconnection mirrors adult disconnection: household poverty rates and the employment and educational status of adults in a community are strongly associated with youth disconnection.
- Where a young person lives is highly predictive of his or her likelihood of disconnection. The findings break down youth disconnection by neighborhoods within cities. The disparities between wealthy and poor communities are striking. For example, in New York, disconnection rates range from 3.7 percent in parts of Long Island to 35.6 percent in parts of the South Bronx.
The report concludes with a set of recommendations for preventing youth disconnection, including moving beyond the “college-for-all” mantra to provide meaningful support and guidance both to young people aiming for a four-year bachelor’s degree and to those whose interests and career aspirations would be better served by relevant, high-quality career and technical education certificates and associate’s degrees.
__________________________________________________________________________
For media and all other inquiries, contact us at: contact@measureofamerica.org.
Common Good Forecaster
Interactive Tool to Map Education Attainment in America
Access the tool here.

United Way and the Measure of America joined forces in 2008 because both organizations focus on the building blocks of a good life – a quality education that starts from birth and ultimately leads to a stable job, enough income to support a family through retirement, good health, and the ability to achieve one’s full potential. Out of this partnership came the Common Good Forecaster™, a tool that shows how vital economic and social issues in your community might change if educational outcomes were better.
This is a forecasting application that uses statistical models drawn from peer-reviewed studies to predict the effect increased levels of educational attainment are likely to have on other important variables. For the vast majority of indicators included, we start from official federal data for particular locations broken out by education level. When adjustments are made in the “mix” of educational attainment, we are assuming that current relationships between education and all other factors in a given geographic area remain the same. Extreme adjustments to the sliders can produce unrealistic results in other factors (ie. unemployment, poverty, and murder rates falling to zero).
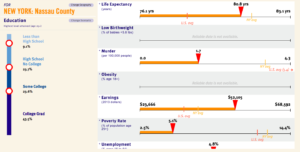
A snapshot of the Common Good Forecaster™ tool as applied to Nassau County in New York
For more information: contact@measureofamerica.org