Young and Adrift: Measuring Youth Disconnection in America Today
This blog post originally appeared in the Huffington Post on September 26, 2016. You can access the original article here.
Co-authored with Alex Powers, Program Associate at Measure of America and Marina Recio, Program Assistant at Measure of America
In July of last year, a group of over a dozen high-profile companies, including Starbucks, Microsoft, and Walgreens, formed the 100,000 Opportunities Initiative and pledged to hire 100,000 young people not in school or working over the next three years. Last month, the Initiative, which has grown to about fifty leading U.S companies, announced that it had met its hiring goal two years before the deadline.
The quick growth of the Opportunities Initiative reflects a rising concern in America about access to opportunity for young people—or rather, the lack thereof. A wide range of recent initiatives seeks to reconnect teenagers and young adults who find themselves detached from school and work, a group referred to as “disconnected youth” or “opportunity youth.” Far too many young people find themselves adrift, detached from the core institutions that give meaning to our lives and structure to our days. Roughly 5.5 million youth between the ages of 16 and 24 are neither working nor in school, about as many people as live in Minnesota or Maryland. Often these young people carry their scars of disconnection into adulthood, where they take the form of lower wages and marriage rates, worse health, less job satisfaction, and even less happiness.
Across-the-aisle consensus now holds that the social and economic costs of youth disconnection are far too high, for both young people personally affected and for society at large. The first step for action is identifying which young people are disconnected, where they live, and which socioeconomic characteristics and barriers to connection they share. Despite what some may think, disconnected youth are not a monolithic group, and all young people do not face the same risks of becoming disconnected.
While youth disconnection has been measured and analyzed for decades by governments in Europe, where these young people are called “NEETS,” (Not in Education, Employment or Training), the focus in the United States is more recent, and different methods for calculating youth disconnection can sometimes result in seemingly contradicting figures. Ultimately, better measurement means a better chance of success at preventing youth disconnection in the first place and reconnecting those who have fallen out of the mainstream.
Measure of America of the Social Science Research Council has taken a closer look at existing approaches as a first step in this direction. What follows is a guide to the differences and relative strengths of existing data on youth disconnection.
Defining Youth Disconnection
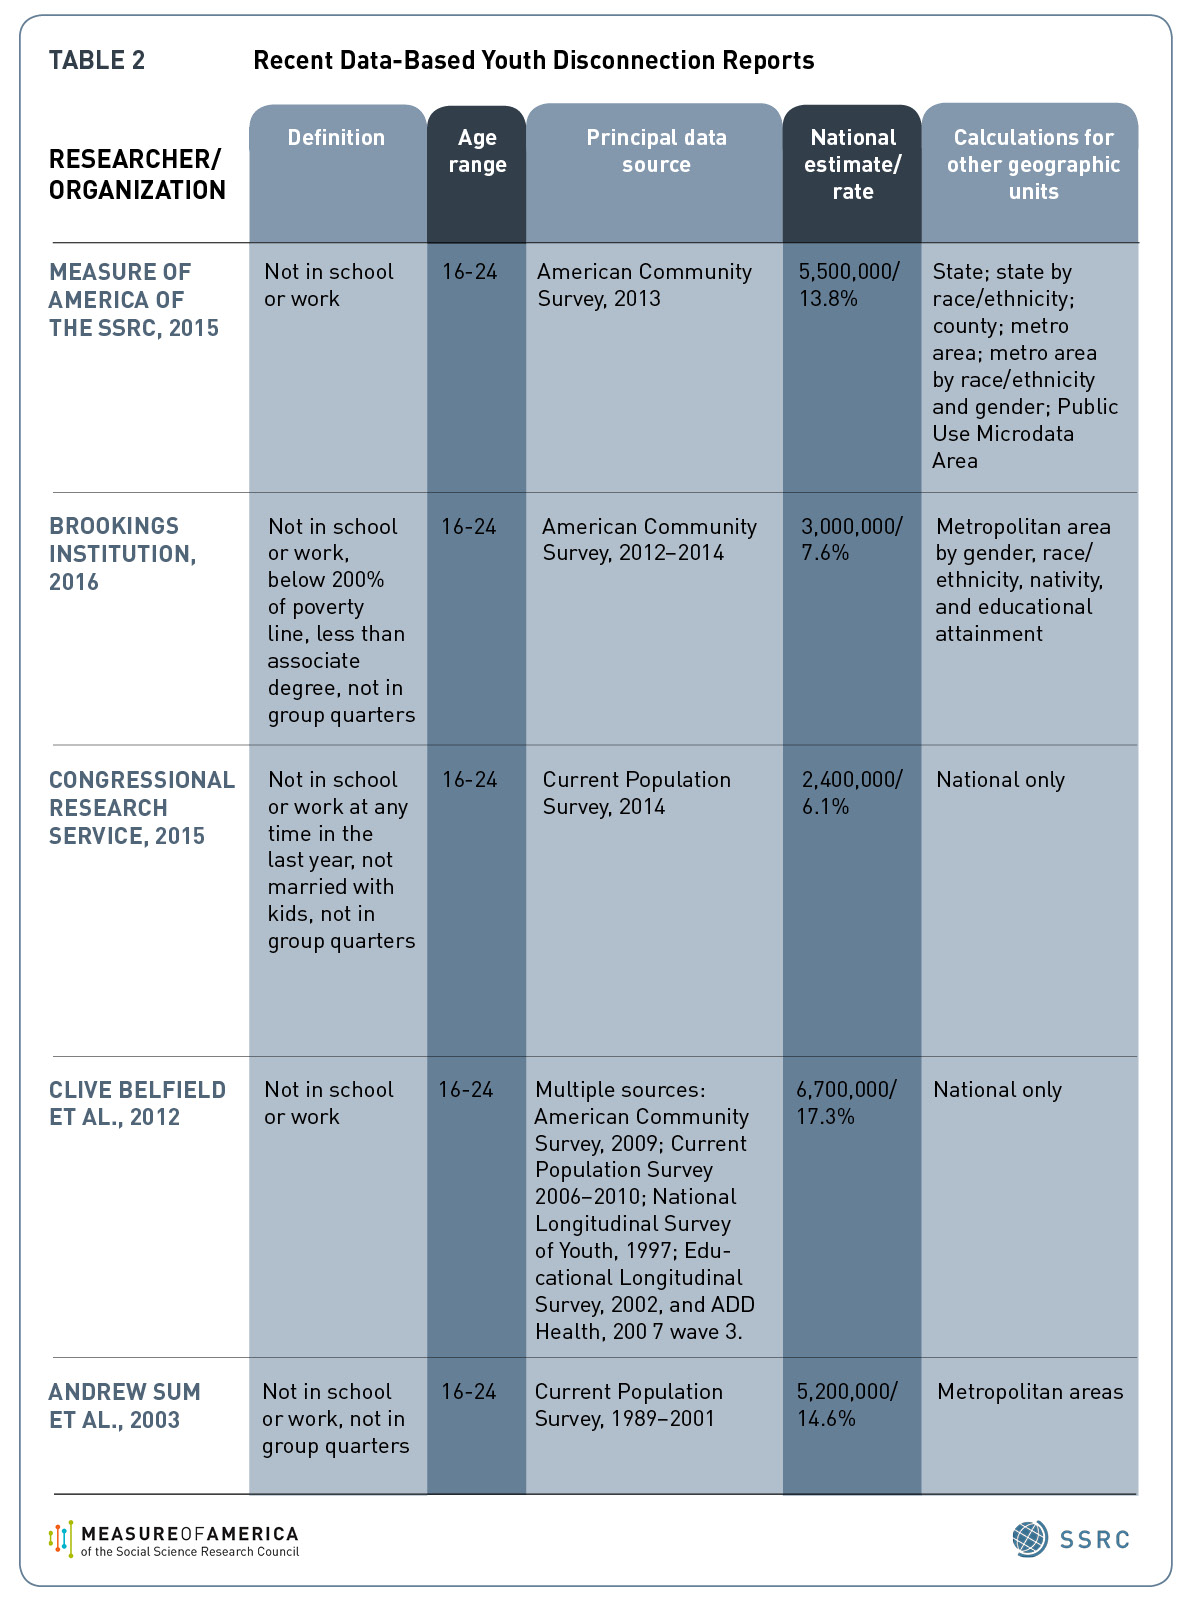
Taking the lead from years of work in Europe, a good basic definition of disconnected youth is this: teens and young adults ages 16 to 24 who are neither in school nor working. This is the definition that Measure of America has used in its data calculations and analysis on youth disconnection since its first report on the topic, One in Seven, published in 2012. It’s also the foundation for most other youth disconnection estimates.
Some researchers have added additional qualifications to this core definition. The Congressional Research Service, for example, in their 2015 report, counted out-of-school-and-work young people who were both married to a connected spouse and parenting a child as connected, given that they engaged in caring labor in the home and were supported by the earnings of a spouse. In addition, they only counted those who were out of work for at least a year as disconnected. The Brookings Institution uses the core definition, but narrows it further to those below 200 percent of the federal poverty line and with less than an associates degree. These qualifications result in significantly smaller estimations of youth disconnection. See Table 2 below for the total U.S. estimate for each of these definitions.
Who Is Considered a “Youth”?
The age range most researchers have used since the 1990s for studying disconnection has been 16 to 24 years of age. Measure of America, Congress, the Congressional Research Service, the Brookings Institution, the Center for Law and Social Policy, and Belfield et al. have used this age range. Other organizations have used a 14 to 24 age range, including a 2008 Government Accountability Office report. The European Union’s standardized definition of their “NEETs” uses the age range 15-24, in large part due to the way their data are collected.
Data Sources
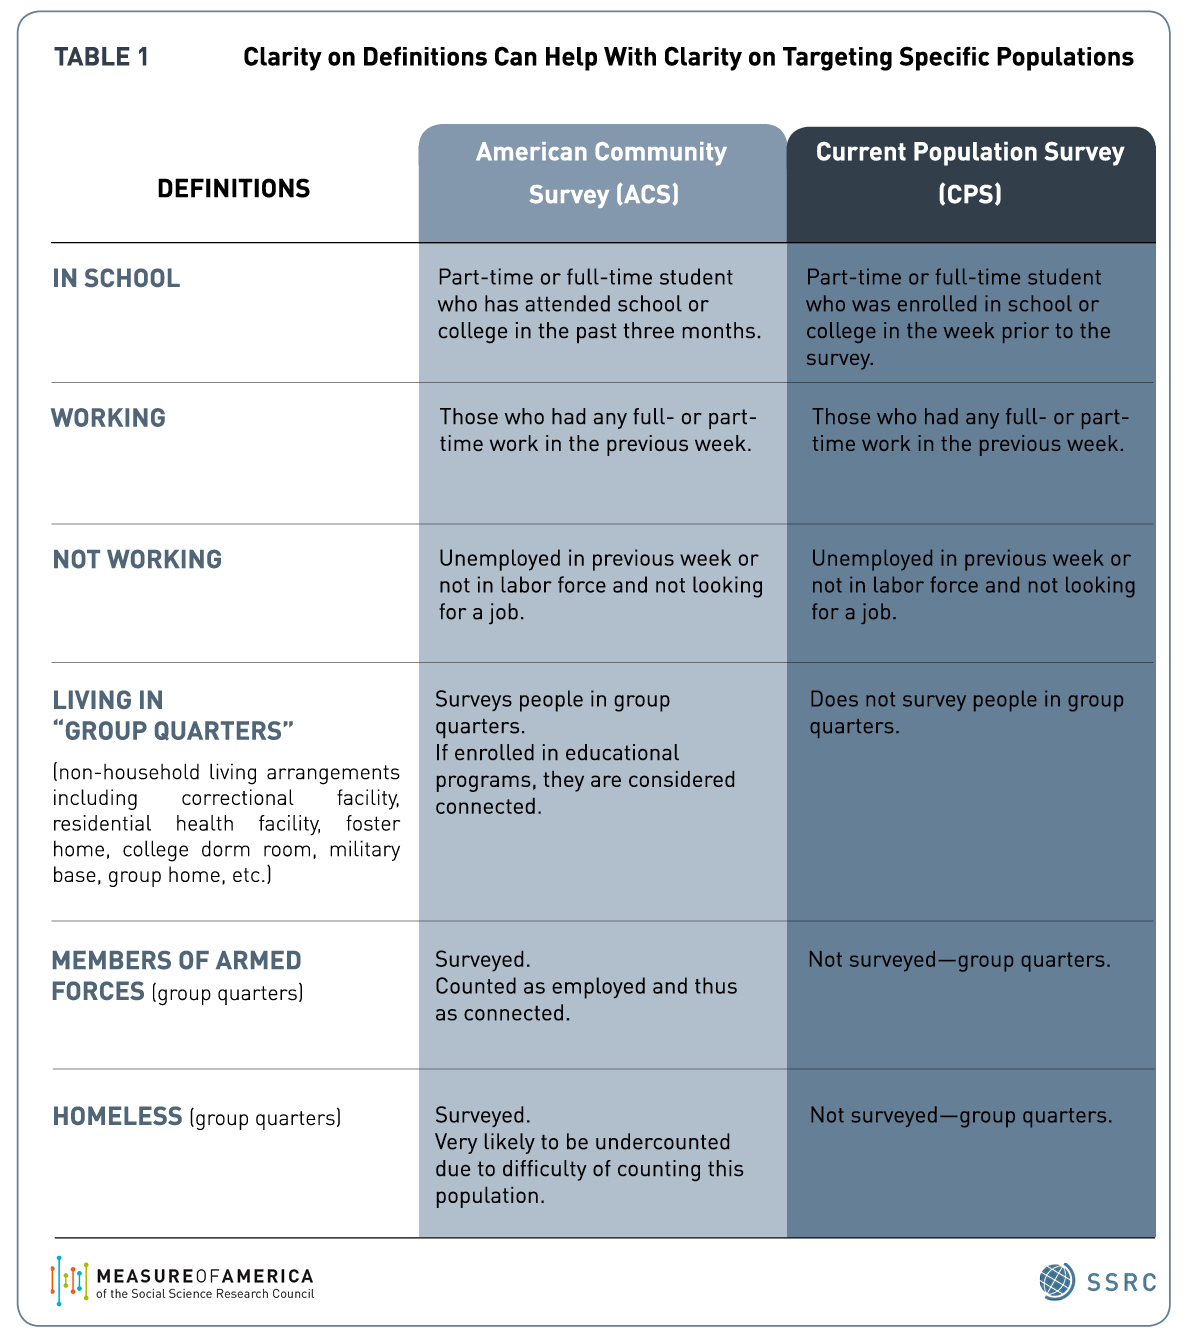
The two main government surveys available for calculating youth disconnection are the U.S. Census Bureau’s annual American Community Survey (ACS) and the Current Population Survey (CPS), which is conducted by the U.S. Census Bureau for the Bureau of Labor Statistics. Using the ACS, Measure of America calculates that there are about 5.5 million youth in the 16 to 24 age range who are neither in school nor working, or one in seven young Americans. Each survey has advantages for understanding the challenges of this population.
The American Community Survey’s main advantage over the Current Population Survey is that the ACS includes a much larger sample size, making it possible to calculate youth disconnection rates in for counties, metro areas, and even smaller geographic areas as well as nationally and by state. It also allows for disaggregation by race and ethnicity and by gender. The ability to disaggregate data can reveal interesting and sometimes surprising insights lurking below national, state or even city-level data—like the impacts of racial segregation on white and black disconnection rates, or the stark inequality in disconnection rates by neighborhoods within large cities like New York.
Another advantage of the ACS is that it surveys young people in “group quarters,”—college dorms, jails and prisons, foster homes, and military facilities; the CPS does not survey those living in these residential facilities. A plus of the CPS is that it is an older survey, with data stretching back to 1940; this makes it possible to look at historical trends. See Table 1 below for further detail.
Conclusion
Lest this roundup leave the impression this is a complex, difficult-to-measure issue, this is not the case. The simple, basic definition and measurement are already a tremendous advance towards making visible a population that has for too long been living in the shadows. The efforts to further striate this population for various subgroups, whether for racial and ethnic groups, teenage boys vs. girls, particular neighborhoods or unmarried young adults, only serves to strengthen our ability to tailor policies and programs to address each group’s particular challenges and needs.
Time to Reform Universal High School Choice
This blog post originally appeared in New York Slant on May 11, 2016. You can access the original article here.
In a bold attempt to break the link between neighborhood conditions and school quality for public school students, New York City launched a universal high school choice program in 2004. The idea was that opening up a wide range of high schools to everyone would give students from low-income neighborhoods access to better schools, and giving families the chance to “vote with their feet” would force low-performing schools to shape up or risk closure.
But in the intervening years, the city didn’t track student performance by home neighborhood, making it hard to tell how well universal choice is working, and for which students. To fill this gap, we gathered data on on-time graduation rates for high school students by their home addresses and mapped them onto the city’s 59 community districts.
We found that location is still highly associated with the likelihood of on-time graduation; meaning students from opportunity-scarce neighborhoods are lagging behind their wealthier peers – regardless of where they go to school.
Disparities in on-time high school graduation rates by neighborhood dwarf those by race, ethnicity and gender, with 34 percentage points separating the best- and worst-performing community districts.
More than 95 percent of students who live in Battery Park City, Greenwich Village and SoHo graduate within four years, compared with just 61 percent of students from Morris Heights, Fordham South and Mount Hope in the Bronx. The largest racial gap in high school graduation rate in the city, though still alarming, is much narrower: 85 percent of Asian students graduated on time last year, compared to 64 percent of Latino students—a difference of 21 percentage points.
Because the city didn’t track these data by place of residence in the past, we can’t assess how different access and outcomes are today than they were in 2004. Even if we had the data from the past, we would be hard-pressed to separate the effects of school choice from the effects of other educational reforms introduced around the same time, such as the shuttering of 29 extremely large, troubled schools.
However, we can use what we know now to begin to assess whether the collective investment in time, stress, and financial resources required of 80,000 eighth graders and their families each year by the high school choice process, not to mention the lengthier daily commutes for high school students, is worth it.
The early evidence suggests that it’s not – at least not for the young people from low-income, black and Latino neighborhoods who still wind up in schools with low graduation rates and classmates who share their socioeconomic disadvantages.
That’s because school access is just one of many factors determining opportunities and outcomes for kids. An analysis of the relationship between on-time high school graduation and other basic socioeconomic indicators using the free mapping and data analysis website DATA2GO.NYC proves that point. Neighborhoods with low on-time high school graduation rates were more likely to have high child poverty rates, low median household incomes and low shares of adults with bachelor’s degrees. Conversely, graduation rates tend to be very high in neighborhoods with low rates of Supplemental Nutrition Assistance Program use.
These findings point to a larger issue: it’s unrealistic to expect a school choice process carried out near the start of high school to remedy the effects of disadvantage, discrimination, and disinvestment years in the making. Making educational equality a reality requires investments in children, families and communities long before children reach ninth grade. The school choice program undoubtedly provides benefits to some children, but it assumes all kids have the resources and supportive adults in their lives needed to help them navigate a bewildering process. This is not the case.
Using these data on high school graduation rates by neighborhood as a baseline, the city should set a goal to slash the gap in graduation rates by community district and make the changes needed to get there. As a start, middle schools need more guidance counselors with smaller caseloads, and students need more good high school options to choose from.
Addressing larger issues of residential segregation by race and income, poverty, the absence of meaningful work, unsafe neighborhoods, lack of political power, and discrimination – challenges that high school students bring with them every morning they commute to high schools in different neighborhoods – is the fundamental educational reform that we as a society must ultimately be willing to make.
Kristen Lewis and Sarah Burd-Sharps are co-directors of Measure of America and co-authors of the study “High School Graduation in New York City” released on May 11, 2016.
How to close NYC’s lifespan gap? The answer may surprise you
This blog post originally appeared in Crain’s New York Business on December 18, 2015. You can access the original article here.
New data reveals a yawning chasm in life expectancy among the city’s residents, with startling implications. While the average life expectancy citywide is 81 years, stunning disparities exist across our neighborhoods. A baby born today in Tribeca can expect to live more than 11 years longer than one born in Brownsville, Brooklyn.
Will Obamacare help? One would think that residents with health insurance would live longer, healthier lives than those without it. After all, insurance helps people afford necessary preventive care, medicine for illnesses, and more. Under Obamacare, New Yorkers must get coverage or face penalties in 2016.
But, surprisingly, the relationship between life expectancy and health insurance across neighborhoods is not statistically significant, according to DATA2GO.NYC, a new public mapping and data website with hundreds of well-being indicators. In fact, the community districts with the lowest percentage of insured adults—Jackson Heights, Elmhurst, and Corona in Queens—have some of the longest life expectancies in the city, around 84 years. In these neighborhoods, only about 60% of adults are covered. In Brownsville, the district with the shortest life expectancy, 80% of adults have health insurance (slightly more than the city average).
Instead, employment is a much stronger predictor of life expectancy in the city. As the unemployment rate decreases, life expectancy tends to rise. While correlation does not equal causation, this connection is compelling and instructive. Unemployment and the economic insecurity it creates can damage health; people struggling with the stress of poverty are vulnerable to premature aging and a higher risk of heart attack, and they are more likely to engage in risky health behaviors like smoking and heavy drinking. Their children are at risk as well: Children who live in economically insecure households tend to have poorer health outcomes than their peers.
These findings don’t imply we should abandon efforts to get more New Yorkers covered by health insurance. Access to doctors and medicine are essential, particularly once you are ill. Rather, they suggest that reducing the massive gaps in life expectancy citywide also requires concerted efforts to address economic insecurity in neighborhoods like Brownsville and Bedford-Stuyvesant.
Employment is one piece of the puzzle that will help improve well-being in neighborhoods like Brownsville. A holistic assessment of New York’s strengths and challenges will help uncover the others.
Sarah Burd-Sharps and Kristen Lewis are co-directors of Measure of America, a nonprofit, nonpartisan research and advocacy initiative of the Social Science Research Council, which created DATA2GO.NYC with a grant from The Leona M. and Harry B. Helmsley Charitable Trust.
From Foreclosure to Homelessness, Now You Can Map NYC’s Problems
This blog post originally appeared in City Limits on December 1, 2015. You can access the original article here.
New York City is rich in data resources for understanding the unique assets and challenges of its diverse neighborhoods. But the information available isn’t necessarily comprehensive, up-to-date, easily accessible, or in the right format, so finding the right data and corralling it into something useful can be a challenge. To make a real impact, policymakers, social service organizations, and advocates working on improving policies and programs need reliable, nonpartisan information to understand how a variety of issues interact to shape people’s choices and opportunities – which is why we created DATA2GO.NYC.
DATA2GO.NYC brings together for the first time federal, state, and local data vital to understanding inequality and how multiple factors combine to influence New Yorkers’ well-being in every neighborhood. It’s a free tool for policymakers, community-based organizations, philanthropists, social service delivery agencies, journalists and all people working to improve life in the Big Apple. The website contains 350 indicators of well-being for each of New York City’s 59 community districts, 150 of which are also available by census tract. Many indicators were previously unavailable to the public, such as data on homelessness and philanthropic giving, or unavailable by community district, such as data on crime and voting. Users can create unique maps and visualizations, prepare community district profiles, test relationships between indicators across neighborhoods, and print or share their results at the click of a button.
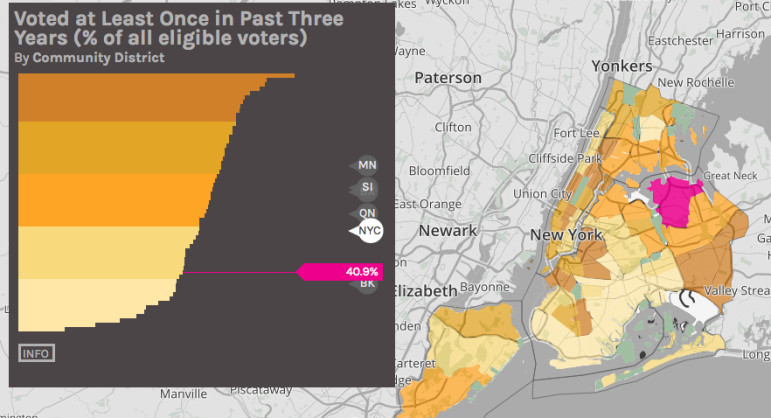
A chart generated by DATA2GO.NYC on political engagement.
This makes it possible to ask and answer questions like “Is there a connection between health insurance and life expectancy in New York City?” or “Which factors intersect to make the life of a child born in Brownsville different than that of a classmate born on the Upper West Side?” The tool is designed to draw new connections across sectors to delve deeper into New York City’s challenges, providing new insights for better, more effective policies and programs.
Take, for example, the ongoing foreclosure crisis among black and Latino households. To explore how foreclosures continue to affect New York City residents, we used DATA2GO.NYC to identify factors related to high foreclosure rates across community districts. In 2009, at the height of the housing bust, foreclosures swept through the city, spiking to an astonishing average of 24 foreclosures per 1,000 properties. The highest rate was in Bushwick, Brooklyn, which saw 61 foreclosed one-to-four family homes per 1,000 properties. The average has since declined to 17 foreclosures per 1,000 properties in 2014. This positive trend, however, masks a highly uneven recovery.
The problem remains stubbornly prevalent in districts with large black and Latino populations. The community districts with the top five foreclosure rates in 2014 are all areas where more than four in five residents are black or Latino. These were Bronx CD 4 (Mt. Eden, Highbridge, West Concourse, East Concourse, and Concourse Village), Brooklyn CD 16 (Ocean Hill and Brownsville), Bronx CD 5 (West Tremont area, South Fordham, University Heights, Morris Heights, and Mount Hope), Brooklyn CD 5 (parts of Broadway Junction, City Line, Cypress Hills, East New York, Highland Park, New Lots, Spring Creek, Starrett City) and Queens CD 12 (Hollis, parts of Jamaica, Jamaica Center, North Springfield Gardens, Rochdale, South Jamaica, St. Albans).
The higher the share of blacks and Latinos in a community district, the higher the foreclosure rate was in 2014. Even after holding median household income constant, the shares of black and Latino populations in a community district still had a significant relationship with foreclosure rates. What is most surprising is that despite the overall recovery, many neighborhoods with high concentrations of black and Latino residents have higher foreclosure rates today than in 2009, at the height of the housing bust and foreclosure crisis.
Owning property in New York City is a dream that many residents never realize. Losing a home after investing so much capital can set families back generations, particularly for black and Latino families who invest larger proportions of their overall wealth in primary homes. The mortgage crisis is clearly not over for them. To avoid the destabilizing impact of foreclosure, greater enforcement is needed in the mortgage servicing industry to protect families of color from predatory lenders. Further reforms should focus on incentives for inclusive lending and reductions in racial and ethnic discrimination in the mortgage market. Reducing rates of foreclosure could allow families to protect their chief assets, build wealth, and promote neighborhood stability, all of which also save the city money in the long run.
We created DATA2GO.NYC to catalyze improvements in policy-making and philanthropy and boost well-being across the five boroughs. How will you use it?
Sarah Burd-Sharps and Kristen Lewis are co-directors of Measure of America—a nonprofit, nonpartisan research and advocacy initiative of the Social Science Research Council—which created DATA2GO.NYC with a grant from The Leona M. and Harry B. Helmsley Charitable Trust. Measure of America statistician Andy Garon contributed to this article.
Reconnecting Youth in America’s Cities
This blog post originally appeared in the Stanford Social Innovation Review on July 2, 2015. You can access the original article here.
For many young people, June is a month replete with excitement and promise. Graduating seniors toss their mortarboards skyward, college kids kick off summer jobs and internships, and newly minted college graduates join the working world in earnest. But for teens and young adults who have dropped out of school or failed to gain a foothold in the labor market, June, like the rest of the year, offers few encouraging opportunities.
These “disconnected youth”—young people between the ages of 16 and 24 years who are neither working nor in school—are unmoored from the jobs, training programs, and academic institutions that anchor and give shape to the lives of their connected counterparts. Absent the experiences and supports that school and work provide, disconnected youth struggle to acquire the skills and credentials they need to live rewarding, freely chosen lives as adults. Youth disconnection stunts human development, with adverse impacts on the affected young people themselves as well as on the economy, social sector, and criminal justice system, and in the political landscape.
According to our recent research, there are 5,527,000 disconnected youth in America today, or nearly 1 in 7 young adults (13.8 percent)—about as many people as live in Minnesota and more than the populations of 30 states.
Though the rate of youth disconnection has fallen since the Great Recession (roughly 280,000 fewer young people are disconnected today than in 2010, the last decade’s peak), the numbers are still higher than pre-2008 levels. And even leaving aside the costs of wasted potential, our society spends billions each year on disconnected youth—a conservative estimate of just some of the direct financial costs tallies $26.8 billion for 2013 alone.
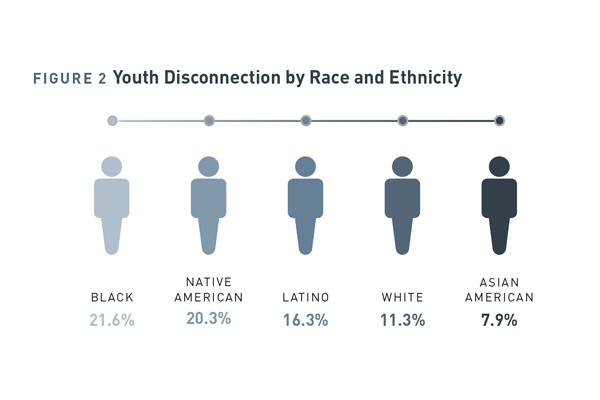
Among the 98 major metro areas we studied—home to two in three Americans—disconnection rates range from less than 8 percent in the Omaha, Nebraska, and Bridgeport, Connecticut, metro areas to more than 20 percent in greater Lakeland, Florida, Bakersfield, California, and Memphis, Tennessee. Nationally, youth disconnection rates for blacks (21.6 percent), Native Americans (20.3 percent), and Latinos (16.3 percent) are markedly higher than rates for Asian Americans (7.9 percent) or whites (11.3 percent). In nine metro areas, at least one in four black youth are disconnected; in 10 metro areas, at least one in five Latino youth are. Clearly, youth disconnection is a complex and highly variable issue. What can we do about it?
First, what won’t work: laying the problem at the feet of disconnected young people themselves and expecting them to solve it on their own. To alter the trajectory of his or her life, a young person needs perseverance, the optimism to envision a better future, and the willingness to work toward it. But disconnected young people face challenges far beyond what they can tackle through sheer willpower. Disconnection is not a spontaneously occurring phenomenon; it is an outcome years in the making. These young men and women tend to come from segregated, historically disadvantaged communities, and their struggles with education and employment too often mirror those of their parents and neighbors.
A meaningful starting point would be for cities to adopt the goal of cutting in half the wide gaps between racial and ethnic groups within their metro areas. In Chicago, for example, 17 percentage points separate the youth disconnection rates for blacks (24.5 percent) and whites (7.5 percent). Halving that black-white gap to 8.5 percentage points within five-to-seven years is an ambitious but achievable goal. Governments, businesses, schools, and nonprofits should join together to establish measurable, time-bound, tailored targets like this one, as well as blueprints for meeting them. Setting customized targets in metro areas across the country and working in concert across sectors to meet them would make the plight of these young people visible at a more local level while also moving the needle on the national problem.
Over the long term, meaningful progress requires preventing disconnection in the first place. A growing body of research suggests several cost-effective preventative investments:
- Helping at-risk parents give their children a good start through programs like the Nurse-Family Partnership
- Prioritizing universal, quality preschool, which imparts the social and emotional skills necessary for success later in life, and is associated with fewer behavioral problems, higher high-school graduation rates, less crime, fewer teen births, and higher wages and rates of homeownership
- Improving K–12 education in neighborhoods with concentrated poverty and under-resourced schools, including offering services to address the emotional, health, and financial challenges young people bring with them into the classroom
- Creating diverse pathways to meaningful careers through apprenticeship and mentoring programs like California’s Linked Learning, which provides high-school students with real-world job experience, experiential learning, and connections between high schools, community colleges, and local businesses
- Boosting civic engagement, which research shows cuts the likelihood of disconnection nearly in half
- Addressing residential segregation by race; our research showed that, in highly segregated metro areas, black youth tend to have higher-than-average rates of disconnection
America spends too much time, money, and effort fighting the consequences of youth disconnection—and too little preventing it. Long-term solutions that improve conditions in disconnected, opportunity-scarce communities, knit these communities into the fabric of the larger society, and create meaningful pathways to adulthood within them is the answer to youth disconnection. Easier said than done, we know. But all of our country’s young people deserve a meaningful shot at their own American dreams.
Two Americas: A Better Way To Measure How We Are Really Doing
This blog post originally appeared on Cognoscenti, a blog of WBUR, Boston’s NPR station on June 4, 2015. You can access the original article here.
There’s a problem with our conception of progress in America: It’s based on money and not much else. We hear a lot about economic indicators like the trade deficit, or the price of oil, or stock-trading volumes, but relatively few people know that young adults in Abington, Brockton and Avon are six times as likely to be disconnected—neither working nor in school—as their counterparts in Allston or Brighton, or that an African-American baby born today can expect to live, on average, 11 fewer years than an Asian-American baby born today.
Economic indicators like gross domestic product (GDP) provide important information, but using them as proxies for societal progress paints an incomplete and often misleading picture. For instance, from 1974 to 2013, America’s GDP grew by more than 200 percent—but during that same time, the relative child poverty rate also grew, from 20 percent to 30 percent. So while we should celebrate New England’s post-recession economic growth, we also must look beyond the marquee numbers to see how this growth is, or isn’t, translating into better lives for people.
The American Human Development Index (HDI) is a better way to think about and measure progress. It combines indicators on three basic building blocks of a good life: health, education and income. And it expresses the result on a zero-to-10 scale. Based on a conceptual framework developed by Harvard’s Amartya Sen and adopted by the United Nations, the HDI enables communities to understand where they stand relative to others, shines a spotlight on opportunity gaps, and helps identify solutions.
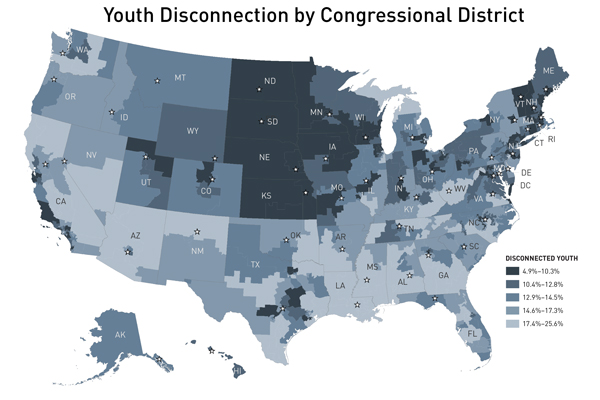
Using the American HDI, we ranked the 435 congressional districts and Washington, D.C. Our analysis revealed astonishing inequalities within regions and states, even in parts of the country that are doing well overall—like New England, which ranks first in terms of well-being among nine Census Bureau-defined regions in the U.S.
What do these rankings mean on the ground, and why do they matter? Compare, for example, New England’s top- and bottom-scoring districts: District 5 in Massachusetts, containing the suburbs north and west of Boston, and District 2 in Maine, a largely rural area covering a majority of the state’s land, and the only one in the region that scored below the national average.
A baby born today in Massachusetts’ District 5 can expect to live, on average, 81.6 years—more than three years longer than a baby born today in Maine’s District 2. The Massachusetts baby—let’s call her Emma, the state’s most popular name for girls in 2014—will grow up in a region in which more than half of all adults have completed bachelor’s degrees, more than one in four hold graduate degrees, and median personal earnings are about $42,000 (about $12,000 more than the national median).
Our Maine baby, little Olivia (Maine’s second-most popular name for girls in 2014), will grow up in a place where far fewer adults, about one in five, have bachelor’s degrees, and where median personal earnings are about $25,000, roughly $5,000 less than the national median.
Higher shares of college graduates in a place are associated with better educational outcomes for children, more economic growth and higher wages, even for those without college degrees. In addition, children whose early years are spent in economically stressed households tend to have worse health as adults than children who grow up in more affluent families. In other words, Emma is likelier to enter adulthood with a good education, find a job, earn higher wages, and even enjoy better health than Olivia.
The HDI shows how disinvestment and neglect have left whole communities behind, especially when it comes to education, health, civic engagement and real opportunities open to young people. For example, compared to children in the suburbs, children living in urban neighborhoods are much more likely to live in poverty, be exposed to safety and health risks, and attend overcrowded, underfunded schools where they feel unsafe, where teachers have high rates of absenteeism, where behavioral problems disrupt learning, and where achievement levels and graduation rates lag.
Though recent national dialogue around income inequality is a step in the right direction, we also need to examine the other ways in which people in America experience opportunity — or the lack of it. Why are young adults in one area six times as likely to be disconnected from both school and work as those just across town? Why should people in one district outlive their neighbors in the adjacent district by six or seven years?
To answer these questions, we need to take an honest look at how and where we are allocating public resources. We also need to rely on indicators that focus directly on people and the real opportunities they have to live rewarding, productive, freely chosen lives. Just some of the ways we can begin to address these inequalities include creating programs that fight the biggest contributors to preventable death in the United States: smoking, poor diet, physical inactivity and excessive drinking; supporting high-quality universal preschool programs; providing more young people access to higher education; helping students complete their degrees; and ensuring that all jobs offer decent wages, economic security and dignity. By including health, education and income in defining a good life, we can more accurately measure progress, and we can begin to drive real change, in New England and across the country.
Domestic Violence: Silence Is Its Greatest Ally
This blog post originally appeared as a commentary on The Huffington Post on February 3, 2015. You can access the original article here.
As many as seven in 10 survivors of domestic violence in the U.S. report that their abusers threatened or hurt the family pet. In some shelters, an astonishing 68 percent of survivors report having been strangled or threatened with strangulation. People whose job it is to provide shelter, legal help, and other services for survivors recognize these two specific forms of control and violence as bright red flags that signal a particularly dangerous pattern of abuse, but the general public typically does not. And even when they fear the worst, most bystanders are at a loss as to what to say or do.
Over the past year, the topic of domestic violence has come forcefully into the public consciousness, spurring national conversations on the need to break the silence around intimate partner violence. The footage of NFL player Ray Rice knocking his then-fiancée unconscious as well as the rapidly growing movements to address sexual assault in the military and on college campuses have made headlines. This has prompted celebrities, athletes, and organizations alike to take a public stand and to urge others to do something deceptively simple that can have a huge impact: talk about it.
As this challenging conversation evolves, it’s important to remember that the problem is bigger than the act of violence itself. Domestic violence has devastating psychological, physical, and economic consequences for those who experience it–and for the children who are exposed to it. Survivors often suffer from a host of long-term physical and mental health problems that have a significant impact on their ability to live a healthy, productive, and fulfilled life. And it’s not something that happens just to other people; one in four women will experience domestic violence during her lifetime, meaning that most of us have violence survivors in our lives, though we may not know it.
In our most recent report, A Portrait of California 2014-2015, we looked at three measures beyond GDP that provide insights into how regular Californians are doing: health, access to education, and earnings. Domestic violence arose as a major factor impacting the well-being of California residents in all three categories. This statistic from this report speaks for itself: in 2013, the number of emergency calls for help in California related intimate partner violence was roughly equal to the total number of all other violent crimes in the state put together. Further, 41 percent of women murdered in 2013 in California were killed in circumstances related to domestic violence, the single largest cause of female homicide in the state.
While our recent focus was on California, domestic violence is, of course, a national problem. Because of the complexity of this particular type of violence–it generally happens behind closed doors, and its victims often have family ties to or are financially dependent on their abusers–it is underreported and under-prosecuted, meaning that domestic violence is even more pervasive than these startling statistics suggest. Domestic violence disproportionately harms women, and men make up the majority of perpetrators. But it can occur among people in many forms of relationships and at many ages–including during teen dating, in LGBTQ couples, and in heterosexual couples where women are the abusers.
Research, including our own, shows time and again that domestic violence is central to any discussion of a long and healthy life. Its toll on the physical and mental health of survivors and their families in California, as in every U.S. state, is staggering. So much so, that we argue that victim services and policies to strengthen and enforce laws, while critically important, are not enough; it’s time for domestic violence to become a national public health issue that is addressed with awareness efforts on par with those around HIV/AIDS, smoking, seatbelt and car seat use, and drunk driving. An incredibly effective way to achieve this is to deploy the reach and power of Madison Avenue.
Such an approach is starting to take hold. The National Football League joined the No More campaign, a national effort to raise public awareness and engage bystanders around ending domestic violence and sexual assault, and is sponsoring deeply affecting ads during football broadcasts, including during yesterday’s Super Bowl. These ads have increased views of NoMore.org by more than 240,000 per month. This is an encouraging start; the target audiences of the NFL’s campaign – young people and men – are typically the most difficult to reach on the topic.
But there is much more to be done. Using the sophisticated market research, tailored messaging, and multimedia techniques for which the ad industry is famous, additional high-profile marketing campaigns could sell change in at least three areas.
The first is to challenge beliefs and behaviors about women and men that contribute to intimate partner violence, including cultural messages that exalt a violent model of masculinity, lionize aggressive men as our heroes in popular culture, excuse controlling behaviors as typical parts of romantic relationships, and tacitly or overtly accept violence against women as normal. A public campaign could teach young people that healthy, respectful relationships are cool; violent ones, and violent people, are not. Beliefs and norms can and do change. A generation ago, getting behind the wheel after several drinks was unremarkable, even the subject of jokes. Today, it is not only a crime with real consequences but also a behavior that most people call out as dangerous, selfish, and stupid.
The second is to educate the public about the common dynamics and patterns of abuse that are widely recognized by experts but largely unknown or misunderstood by the general public. Being strangled, for instance, is a telltale warning sign of potentially lethal domestic violence. A campaign that flags strangulation and other widely-observed patterns has the potential to save women’s lives and protect countless others, especially children, from the harmful effects of family violence.
And the third is to redefine norms about how we bystanders should react and what, specifically, we can do when we see signs of domestic or sexual violence. Expanding and increasing awareness of and access to bystander programs like the successful Green Dot and UpStander initiatives currently provided nationwide and in New York, respectively, is a good place to start.
Domestic violence is a pervasive, complicated public health issue that requires an equally pervasive and multi-layered response. In addition to legislation and survivor support programs, we need the targeted, road-tested messaging of the ad industry to drive national awareness and begin the process of transforming attitudes towards both survivors and perpetrators of domestic violence. The potential for improving the health, well-being, and economic future for the survivors, families, and communities impacted by intimate partner violence is too immense to ignore.
Moving the Needle on Youth Disconnection
This blog post appeared as a commentary on the Spotlight on Poverty and Opportunity site on July, 7, 2014. You can access the original article here.
Among the 25 largest U.S cities, the youth disconnection rate ranges from 9.2 percent in Boston to 18.8 percent in Riverside-San Bernardino. The variation of rates from neighborhood to neighborhood within these and other cities, however, dwarfs the variation between them. The starkest inequalities are found in Chicago, New York, and Detroit, in that order, where gaps between neighborhoods are as large as 30 percentage points.
What do these three cities share, aside from high neighborhood inequality? This: Detroit, New York, and Chicago are the three most racially segregated of the twenty-five most populous cities.
Further, our analysis shows that most communities with high shares of disconnected youth in 2011 also had high shares of disconnected youth in 2000, more than a decade earlier—a relationship that holds true even when controlling for population growth and demographic change. The persistence of youth disconnection in low-income, highly segregated neighborhoods where adults struggle with limited education and high unemployment suggests both an absence of effective action on the scale necessary to make meaningful change and the presence of deeply entrenched human poverty, defined as a lack of not just income but also access to knowledge, strong social networks, and civic engagement. It also means that youth disconnection has become a normal and expected experience in these communities. Young people in today’s most disconnected neighborhoods were in elementary school in 2000, and at that time, as many as three in ten teens and young adults in their lives were not working or in school—shaping these young children’s expectations about the future.
Solving the youth disconnection crisis requires three sets of actions. The first step is to actively reengage and reconnect young people who are disconnected today. The second step is to prevent disconnection tomorrow by improving the conditions and opportunities that exist in high-disconnection neighborhoods. The third step is for organizations and individuals active in this area to join together to establish realistic, measureable, time-bound targets for reducing youth disconnection and work collectively to meet them.
This last point is a vital but overlooked key to moving the needle on youth disconnection. To make progress, the diverse actors who work with disconnected young people must not only agree to coordinate, but they should also decide together what success will look like. Setting a goal to halve the national youth disconnection rate from 14.6 percent to 7.3 percent by 2030 is appealing in its simplicity. But a national goal can feel too far removed from the individualized efforts that are needed within each community. A more motivating and meaningful aim would be to cut in half the disconnection gap between neighborhoods and between racial and ethnic groups within each metro area.
What would this mean in practice? In Philadelphia, where the African American youth disconnection rate is 25 percent and the white rate is 9 percent – a gap of 16 percentage points – halving the gap would mean that no more than 8 percentage points would separate African Americans and whites. In terms of Philly neighborhoods, where the highest rate is 30 percent and the lowest 3 percent – a gap of 27 percentage points – halving the gap would mean no more than 13.5 percentage points separating affluent Main Line suburbs from city neighborhoods like Kensington and Richmond.
While these gaps are still too large, meeting goals like these in cities across the country would represent significant and attainable progress—and a more hopeful and promising future for hundreds of thousands of young Americans. The time to act is now. – See more at: http://www.spotlightonpoverty.org/ExclusiveCommentary.aspx?id=19e9820c-b210-4328-a4c9-1cdd74227016#sthash.MI4Ookip.dpuf
The Great Recession may be over, but its pernicious effects endure in the lives of millions of young people. The downturn triggered a surge in the number of disconnected youth—people between the ages of 16 and 24 who are not working or enrolled in school. And especially alarming is the concentration and persistence of disconnection within particular communities, giving lie to America’s promise of equal opportunity
Disconnection from the societal anchor structures of school and work during the transition to adulthood has serious consequences for young people themselves as well as society as a whole. Research shows that young people never entirely recover from long spells of disconnection; instead, they carry scars of their lost years for the rest of their lives in the form of lower wages, worse health, lower marriage rates, greater unemployment, more contact with the criminal justice system, and even less happiness.
Our organization, Measure of America, has worked to document the rate of disconnection within different groups, cities, and neighborhoods. Nationally, about 5 million young Americans were disconnected before the recession in 2007, but by 2010, that figure had swelled to 5.8 million—roughly one in every seven Americans between the ages of 16 and 24. Unfortunately, the tide of youth disconnection has been slow to recede, barely budging from 14.7 percent in 2010 to 14.6 percent a year later, with dramatic variations between racial and ethnic groups as well as between and within cities.
African Americans have the highest rate of youth disconnection (22.5 percent) and are about three times as likely as Asian Americans and twice as likely as whites to be disconnected in their teens and early twenties. Latino young people have the second-highest rate of youth disconnection (17.9 percent).
Among the 25 largest U.S cities, the youth disconnection rate ranges from 9.2 percent in Boston to 18.8 percent in Riverside-San Bernardino. The variation of rates from neighborhood to neighborhood within these and other cities, however, dwarfs the variation between them. The starkest inequalities are found in Chicago, New York, and Detroit, in that order, where gaps between neighborhoods are as large as 30 percentage points.
What do these three cities share, aside from high neighborhood inequality? This: Detroit, New York, and Chicago are the three most racially segregated of the twenty-five most populous cities.
Further, our analysis shows that most communities with high shares of disconnected youth in 2011 also had high shares of disconnected youth in 2000, more than a decade earlier—a relationship that holds true even when controlling for population growth and demographic change. The persistence of youth disconnection in low-income, highly segregated neighborhoods where adults struggle with limited education and high unemployment suggests both an absence of effective action on the scale necessary to make meaningful change and the presence of deeply entrenched human poverty, defined as a lack of not just income but also access to knowledge, strong social networks, and civic engagement. It also means that youth disconnection has become a normal and expected experience in these communities. Young people in today’s most disconnected neighborhoods were in elementary school in 2000, and at that time, as many as three in ten teens and young adults in their lives were not working or in school—shaping these young children’s expectations about the future.
Solving the youth disconnection crisis requires three sets of actions. The first step is to actively reengage and reconnect young people who are disconnected today. The second step is to prevent disconnection tomorrow by improving the conditions and opportunities that exist in high-disconnection neighborhoods. The third step is for organizations and individuals active in this area to join together to establish realistic, measurable, time-bound targets for reducing youth disconnection and work collectively to meet them.
This last point is a vital but overlooked key to moving the needle on youth disconnection. To make progress, the diverse actors who work with disconnected young people must not only agree to coordinate, but they should also decide together what success will look like. Setting a goal to halve the national youth disconnection rate from 14.6 percent to 7.3 percent by 2030 is appealing in its simplicity. But a national goal can feel too far removed from the individualized efforts that are needed within each community. A more motivating and meaningful aim would be to cut in half the disconnection gap between neighborhoods and between racial and ethnic groups within each metro area.
What would this mean in practice? In Philadelphia, where the African American youth disconnection rate is 25 percent and the white rate is 9 percent – a gap of 16 percentage points – halving the gap would mean that no more than 8 percentage points would separate African Americans and whites. In terms of Philly neighborhoods, where the highest rate is 30 percent and the lowest 3 percent – a gap of 27 percentage points – halving the gap would mean no more than 13.5 percentage points separating affluent Main Line suburbs from city neighborhoods like Kensington and Richmond.
While these gaps are still too large, meeting goals like these in cities across the country would represent significant and attainable progress—and a more hopeful and promising future for hundreds of thousands of young Americans. The time to act is now.
The Search for Lasting Solutions
This blog post appeared as the conclusion to Bread for the World’s annual Hunger Report. You can find the Hunger Report here.
Fresno County, California, leads the nation in agricultural productivity, with an annual agricultural output valued at $6.8 billion. Fresno farms yield a cornucopia of fresh food, producing more grapes, chicken, turkey, milk, tomatoes, peaches, plums, and almonds—among others—than any other U.S. county. Paradoxically, Fresno also has a higher rate of food insecurity than any other California county. One in five residents—more than 190,000 people—experience times when they don’t have enough food for an active, healthy life.There’s no better illustration that hunger in the United States is not due to a lack of food than Fresno, a county whose workers literally feed America, yet often cannot feed themselves.
The presence of hunger amid plenty is profoundly troubling, its persistence even more so. If we’re being honest with ourselves, while the composition of the hungry population has certainly shifted over time, we have failed to move the needle on this issue in any fundamental way for more than a decade. U.S. Department of Agriculture statistics show household food insecurity hovering just under 12 percent from 1998 to 2007, after which it rose above 14 percent in the aftermath of the Great Recession. The household food insecurity rate in 2012 was 14.5 percent, which translates to nearly 49 million Americans.
The puzzling part is that this problem endures despite excellent research about the root causes of food insecurity, years of advocacy, important policy reforms, innovative programs on the ground to feed people, the dedication of myriad volunteers, and significant financial resources. Collectively, the government and private organizations spent about $115 billion fighting hunger in 2011. That’s $315 million every single day.
There’s so much first-rate work being done to understand and address hunger in America, and the richest country in the world certainly lacks neither money nor food. We need to figure out how to pull this work together such that it equals more than the sum of its parts.
Measure of America’s aim is to rethink the ways in which we as a society understand and measure disadvantage, with a view to reframing the debate and reengaging Americans in the search for lasting solutions. One way we do this is by using numbers to tell the story of what’s going on with everyday Americans. Measure of America’s American Human Development Index is the cornerstone of this work. Another is to highlight what’s working, not just in the United States but also around the world, to improve well-being and expand opportunity.
In September 2000, leaders from 189 countries met at the United Nations and agreed to work jointly toward eight measurable, time-bound goals to reduce global poverty—goals such as halving the percentage of people who are undernourished, reaching 100 percent elementary school enrollment, and providing access to HIV/AIDS treatment for everyone who needs it. They were called the Millennium Development Goals (MDGs).
The MDG rallying cry did not, of course, solve all of the world’s problems, but it spurred tremendous action and results. The global target to cut the proportion of people living in extreme poverty by half was reached ahead of the 2015 deadline, as were goals on access to safe water, fewer malaria deaths, and better living conditions for slum dwellers. In addition, the world is on track to meet the hunger and tuberculosis targets.
The MDGs were remarkably powerful and successful for many reasons. They helped focus governments and NGOs on achieving a limited set of clear objectives in areas that were central to human well-being, and they made it hard for those who preferred to look the other way to continue denying the existence of severe human deprivation. They galvanized collaboration and brought home the realization that duplication and competition among similar organizations would not get the world across the finish line. They created a more predictable environment in which recipient governments and NGOs weren’t pulled this way and that by constantly shifting donor priorities, making longer-term planning and programming possible. And most importantly, the MDG process put in place a system of accountability in which progress toward the goals was tracked annually and communicated widely. This regular, accessible reporting put persistent divides, such as those between rural and urban areas and between the very poorest and everyone else, into bold relief. The shift from measuring inputs (we lent $2 million, we installed fifty wells, we trained one hundred teachers) to measuring outputs (50 percent fewer people dying of malaria, twice as many girls enrolled in secondary school, half as many people drinking unsafe water) meant that investments had to yield tangible results to count as progress.
The eighth goal involved raising the money to pay for this progress. The flow of foreign aid had dwindled during the 1990s, and the international consensus around the ambitious MDG targets provided a shot in the arm for development assistance. Total development aid went from $79 billion in 2004 to almost $129 billion in 2010 (in constant 2009 dollars).3 Though that sum fell short of what some had hoped for, and funds slowed after the global recession, such an increase had been unthinkable in the business-as-usual scenario.
The MDGs encouraged a wide range of actors to pull in the same direction and provided a clear measure of success. Could those in the United States working to reduce hunger and food insecurity commit to a small set of widely-agreed outcomes—within a set time period— that would focus efforts, increase collaboration, and maybe even stimulate some healthy competition in an area where today too many Americans are paying too little attention? We think it’s worth a try.
Dismal Numbers for Disconnected Youth
This blog post appeared as a commentary in the Huffington Post on July, 9, 2013. You can access the original article here.
At Measure of America, we have charted the share of 16- to 24-year olds in the 25 most populous metro areas who are not working or enrolled in school; they are America’s disconnected youth. Our latest report, “Halve the Gap by 2030: Youth Disconnection in America’s Cities,” shows that 5.8 million youth fit into this category. While youth disconnection is a national epidemic, our research reveals its disproportionate impact on young people of color.
African-American and Latino teens and young adults are far less likely to have a job or to be enrolled in a formal educational program than their white and Asian-American counterparts. The average youth disconnection rate for Latinos is 17.9 percent, compared with 11.7 percent for whites. While Latinos are roughly as likely as other young people to be employed, they are much less likely to be enrolled in school. In fact, 54.6 percent of Latino youth are enrolled in school, compared with the national average of 61.7 percent. African-American youth are nearly three times as likely as Asian-American youth and twice as likely as white youth to be disconnected from employment and school. In contrast to Latinos, the primary challenge for African-Americans is their attachment to the workforce. Nationwide, 61.9 percent of Latino youth are employed, compared with just 45.2 percent of African-American young people.
Analysis at the neighborhood level shows that communities with large percentages of African-American and Latino youth are the most disconnected. In Boston—the metro area with the lowest rate of youth disconnection overall—the rates for African-Americans (14.2 percent) and Latinos (18.6 percent) are much higher than that of whites (7.2 percent). In Washington and Minneapolis—the second- and third-most connected cities—one in every five African-Americans ages 16 to 24 is disconnected. Furthermore, disparities in disconnection rates between neighborhoods in the 25 most-populous metro areas are most pronounced in the cities where residential racial segregation is prevalent. In Detroit, New York, and Chicago—the three most racially segregated cities—disconnection rates vary by as many as 30 percentage points between neighborhoods.
Communities with large shares of African-American and Latino youth are the most disconnected because they face a host of structural and institutional barriers, including poverty and education inequality. Six characteristics strongly associated with disconnected neighborhoods are low human-development levels, high poverty, high adult unemployment, low adult educational attainment, and a high degree of residential segregation by race and ethnicity. Clearly, youth disconnection is an issue that is larger than any single young adult; the problem reflects and reinforces the conditions parents, families, and the larger community struggle with.
The institutionalized drivers of youth disconnection are even more evident when one looks at the data over an extended period. Youth disconnection rates by neighborhood from 2000 are strongly associated with youth disconnection rates today in those same areas. Our report shows that neighborhood-level youth disconnection in 2000 explains about 74 percent of the variation in disconnection in those same neighborhoods at the end of the decade (2011), even after taking into account population growth and demographic change. Entrenched youth disconnection shows that it has become a normative experience in these communities. When the young people who are disconnected today were in elementary school a decade ago, as many as three in 10 teens and young adults in their lives were not working or in school—shaping their own expectations about the future.
Solving the youth disconnection crisis requires reengaging and reconnecting young people who are disconnected today as well as preventing disconnection tomorrow by improving conditions and opportunities in disconnected communities. But to really move the needle on this issue, the actors working to put an end to youth disconnection must join together and establish measurable, time-bound targets for reducing the gaps between racial and ethnic groups and between neighborhoods.
In Philadelphia, the African-American youth disconnection rate is 25.2 percent and the white rate is 8.9 percent—a gap of 16.3 percentage points. The highest neighborhood disconnection rate is 30 percent, and the lowest is 3.2 percent—a gap of 26.8 percentage points. Halving the gap would mean no more than 8.15 percentage points separating African-Americans and whites, and no more than 13.4 percentage points separating neighborhoods. While the gaps would still be large, the needle would be moving in the right direction. Setting clear targets raises awareness, galvanizes resources and action, provides a gauge for assessing effectiveness and progress, and encourages diverse actors to pull together toward the same ends—just what this stubborn problem and the young people affected by it need.
The authors are co-directors of Measure of America, a project of the Social Science Research Council. Their most recent report expands on their 2012 research, “One in Seven: Ranking Youth Disconnection in the 25 Largest Metro Areas.”