America Is a Dangerous Place to Be a Kid
April 12, 2018 — The Nation
Indiana Among States With Shortest Life Expectancy
April 12, 2018 — WBIW
Great News For Californians When It Comes To Life Expectancy
April 6, 2018 — KSRO
Youth Disconnection Rates Highlight Structural Barriers to Achievement in the US
This blog post originally appeared in SSRC’s Items on April 3, 2018. You can access the original article here.
By: Kristen Lewis, Sarah Burd-Sharps and Becky Ofrane
Youth disconnection—the rate of young people ages 16–24 who are not in school or working—is a strong indicator of a community’s collective capabilities and a telling gauge of its residents’ access to opportunity. The consequences of youth disconnection reverberate through communities and society as a whole: a labor force with too few skilled workers to fill entry-level jobs, which require greater skill than entry-level jobs a generation ago, much less to compete in today’s global economy; greater need for public assistance of all sorts; higher rates of crime and incarceration, which have high personal and societal costs; poor physical and mental health, costly in both human and financial terms; and a heightened risk of poor outcomes for the next generation.
Measure of America’s newest report on youth disconnection in America, More than a Million Reasons for Hope,11 shows that in 2016, a total of 11.7 percent of young Americans were disconnected, an improvement from the 2015 rate of 12.3 percent, and a 20 percent decrease from the 2010 peak rate of 14.7 percent, in the aftermath of the Great Recession. Yet 4.6 million young people remain out of work and out of school. This overall improvement is cause for celebration, and underscores the importance of a thriving economy, but a deeper look at the data by race and ethnicity shows concerning trends—particularly the gap between Asians and whites on one hand and Latinos, blacks, and Native Americans on the other—pointing to structural problems in society that economic growth alone cannot solve.
Understanding the dynamics of this population matters. Emerging adulthood—that intense, exciting, and sometimes overwhelming period when our adult selves start to take shape—is a pivotal time in life. For connected young people, it is a time marked by positive firsts: the giddy thrill of hopping behind the wheel of the family car for that first solo spin, the pride of high school graduation, the sense of agency that comes with a first paycheck. Disconnected young people are robbed of these critical and affirming experiences. The limited education, social exclusion, lack of work experience, and minimal professional networks that are part and parcel of disconnection have long-term consequences that snowball through the years, affecting a range of well-being outcomes, from earnings and self-sufficiency to physical and mental health to relationship quality and family formation.

Is economic growth enough?
If disconnection rates are on a steady decline as the economy has expanded since 2010, isn’t that enough to suggest the trend will continue, and demonstrate that more and more young people are on their way to achievement? As we’ll explore further, there are a number of reasons to believe that depending on economic growth alone will not fully address the remaining gaps between racial and ethnic groups. Deep structural barriers to equitable advancement have existed for generations—particularly for blacks and Native Americans in the US—including the historical and continued discriminatory policies and practices present in the health and criminal justice systems as well as in the labor and housing markets. This structural racism pervades institutions and policies that in turn reinforce discriminatory beliefs and the distribution of resources. Acknowledging the ways in which the de jure racism of the past continues to cast its shadow into the present and developing programs that address racism explicitly will be needed to improve outcomes for young people of color. We are doubtful that economic growth alone will overcome these structural barriers for three reasons.
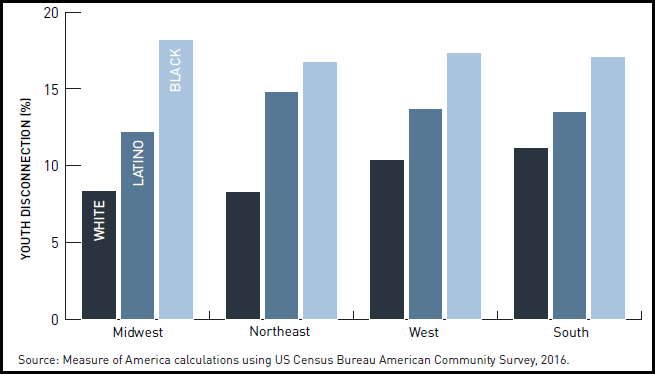
First, we’ve been studying youth disconnection since 2012 and the racial gap has been apparent nationally for all years of data we’ve analyzed, as well as in nearly every region, state, metro area, and county for which we have sufficient data to calculate it by race and ethnicity. Dividing the country regionally, blacks are faring best in the Northeast, with a 16.8 percent youth disconnection rate, which is still significantly higher than the region where whites are most disconnected (the South, at 11.2 percent). There are glimmers of hope where gaps have narrowed for some—for instance, Latinos have made the most progress in closing the gaps (from 18.5 percent in 2010 to 13.7 percent now)—but the disparities remain obvious and damaging.
Second, black, Latino, and Native American young people are particularly disadvantaged in ways that exacerbate their potential for disconnection.
• Poverty. Youth disconnection is strongly associated with poverty. Young people growing up in poverty face a range of challenges, such as residential segregation, poor-quality schools, inadequate transportation, worse health outcomes, greater exposure to neighborhood crime and violence, and more adverse childhood events. These challenges make it more difficult to thrive in school and create barriers to employment (for example, criminal histories, lack of academic accreditation). For certain groups, such as disconnected young women who are black as well as disconnected young women who trace their heritage to the Spanish-speaking Caribbean, the poverty rate approaches 50 percent.
• Incarceration. Incarceration has a known disproportionate impact on black communities and families. Compared to 4.5 percent of disconnected white young people, 12 percent of disconnected black youth live in institutionalized group quarters. Breaking it down further, nearly a fifth of disconnected black boys and young men are institutionalized, compared to only 7 percent of white boys and young men. Another factor to acknowledge is the impact of parents’ incarceration in black youth’s family stability and structure.
• Parenthood. Nearly one-third (31.2 percent) of disconnected Latinas are mothers. When connected, Latinas are less likely to be mothers than black and Native American girls, but once disconnected, they are by far the most likely.
• Education. Staying connected to school appears to be a disproportionate challenge for Latino youth. Previous MOA research2 found that Latino young men were as likely as white and more likely than black young men to be employed, but less likely than either to be enrolled in school. A third of disconnected Latino males did not complete high school—the highest rate of any group of disconnected young people. Among disconnected girls, Latinas are the most likely to have dropped out of high school (29 percent), followed closely by Native American girls and young women (28.5 percent).
Lastly, black young men face particularly high rates of youth disconnection, regardless of family income. Our study launched on the same day as the most recent research from Raj Chetty et al. on the black-white gap in upward mobility, Race and Economic Opportunity in the United States: An Intergenerational Perspective.
American Indian and black children have much higher rates of downward mobility than other groups. Black children born to parents in the top income quintile are almost as likely to fall to the bottom quintile as they are to remain in the top quintile. By contrast, white children born in the top quintile are nearly five times as likely to stay there as they are to fall to the bottom.
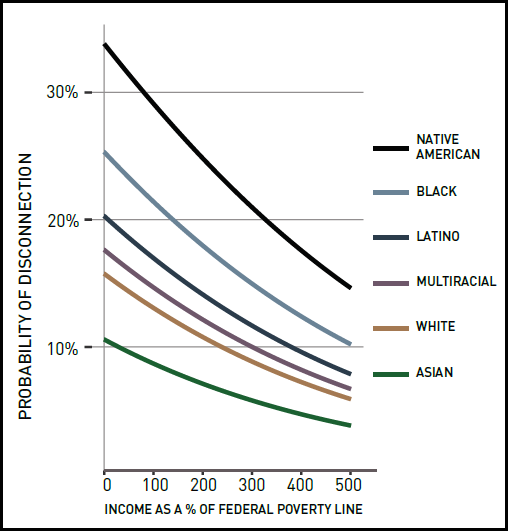
We found similar racial and income divides last year in our report Promising Gains, Persistent Gaps. Even at the highest income levels, the racial differences between disconnection rates hold firm—i.e., rich minority youth are still more likely to be disconnected than rich white youth. In fact, white youth living at the poverty line are as likely to be disconnected as black youth living in households with incomes four times the poverty line and Native American youth in households with income five times the poverty line.
In Measure of America’s 2015 report, Zeroing In on Place and Race, we found that the more racial segregation that exists in a metro area, the higher the level of youth disconnection for blacks and the lower the rates for whites. In other words, concentrated residential segregation by race and ethnicity within major metropolitan areas has very negative impacts for black teenagers and young adults, who are more likely than whites to live in low-income neighborhoods with historically under-resourced schools and transit systems, less access to employment, and weaker social networks. White youth in these metro areas, on the other hand, are more likely to enjoy the benefits of their families’ own larger incomes, as well as broader neighborhood advantages—good schools, convenient transport to jobs, a rich array of extracurricular activities, and proximity to other adults with valuable contacts and connections.
The study by Chetty et al. also speaks to the previously mentioned incarceration rates of black boys and men as well as the gender gap in achievement outcomes among black young people. One example is black women’s higher college attendance rates compared to white males, conditional on parental income. Our research corroborates these gender differences within the black population, and this difference is apparent as early as the 16–24 age range. The gap in youth disconnection rates between men and women is largest for black youth. Nationally the rate is 5.9 percentage points higher for black men than black women. In the Philadelphia metro area, the male-female gap is nearly 10 percentage points.
Data for change
The racial and ethnic gaps in youth disconnection rates today are testaments to the historical truth of discriminatory practices in the United States, as well as mechanisms by which inequality is perpetuated in the here and now. Policies that aim to improve outcomes for youth and reconnect them to mainstream society will need to address the roots of disconnection cultivated years earlier.
Underfunded schools have left too many young people unprepared for today’s job market and without the adult guidance and support they need to succeed. Public transportation that skirts around rather than serves low-income communities makes it logistically and financially hard to reach educational, training, and employment opportunities. Residential segregation by race and ethnicity as well as by education and income—the legacy of discriminatory laws and policies—means that too many young people are growing up in neighborhoods weighed down by concentrated, multigenerational poverty, where adults also struggle with connection to work and school, where exposure to violence limits human flourishing, and where youth disconnection is so entrenched as to be normative. And the disproportionate institutionalization of youth of color continues apace at a time when overall incarceration is declining, creating yet another set of barriers.
Solutions are needed that cross these previously fractured systems—schools, criminal justice, banks and lending, philanthropy—and there are excellent local organizations showing that doing so works. It’s also crucial to include youth in their own solutions and engage them in the conversation to create change. The participation of young people in recent workshops and discussions Measure of America has been involved in has revealed often-overlooked issues around trust and transparency. Data can be our guide, helping organizations working to address the problems facing youth to effect real, lasting improvements. We imagine a day where national economic growth lifts everyone up collectively, but know that much work lies ahead.
1 More than a Million Reasons for Hope analyzes youth disconnection in the United States by more than race and gender, revealing important disparities—and developments—geographically. Accompanying the full report is an interactive data tool, where users can explore the data with maps and visualizations.
2 See Kristen Lewis and Sarah Burd-Sharps, One in Seven: Ranking Youth Disconnection in the 25 Largest Metro Areas (2012); Kristen Lewis and Sarah Burd-Sharps, Halve the Gap by 2030: Youth Disconnection in America’s Cities ( 2013); Kristen Lewis and Sarah Burd-Sharps, Zeroing In on Place and Race (2015); Kristen Lewis and Sarah Burd-Sharps, Promising Gains, Persistent Gaps (2017).
Housing Matters: Chipping Away at School Segregation
March 31, 2018 — Norwood News
Five surprising takeaways from new data on youth disconnection in San Diego County
March 30, 2018 — San Diego Workforce Partnership
Facing dearth of skilled employees, STEMposium seeks to ‘light a fire’ in kids – especially girls
March 28, 2018 — The Bakersfield Californian
March 15: Opportunity Youth San Diego Webinar
March 15, 2018 — Webinar. Kristen Lewis participated in “New Data on Youth Disconnection: State of Opportunity Youth in San Diego County,” a webinar unveiling the latest numbers on disconnected youth in San Diego calculated by Measure of America. The data is part of a collaboration between the San Diego Workforce Partnership and Measure of America to assess youth disconnection, set goals and track progress in the county. You can watch the recorded webinar and see the slides. For more information on the effort to reduce youth disconnection in San Diego, visit OpportunitySD.org.
March 25: National Association of Workforce Boards Annual Forum 2018
March 25, 2018 — Washington, DC. Measure of America’s Sarah Burd-Sharps will speak at the National Association of Workforce Boards Annual Forum about Measure of America’s collaboration with the San Diego Workforce Partnership to address youth disconnection in San Diego. Click here for more information about the event.
A Portrait of Los Angeles County Revisited: Responding to Scholars’ Reflections
This blog post originally appeared in SSRC’s Items on March 20, 2018, and is part of a series of reflections on A Portrait of LA County. You can access the original article here.
By: Kristen Lewis and Sarah Burd-Sharps
We first want to give our sincere thanks to Jennifer Lee, Pedro Noguera, and Kelly Lytle Hernandez and Terry Allen for taking the time to provide commentary on Measure of America’s recent report, A Portrait of Los Angeles County. We are grateful that these leading thinkers were willing to engage with the report and share their views about it. Their reviews come at an ideal time; we are nearing the final stretch of our next report, A Portrait of New York City, and they will see some of their suggestions reflected in it.
Measure of America and human development
Before addressing the three reflections, we want to summarize the conceptual basis for Measure of America. We started Measure of America in 2007 (now a program of the Social Science Research Council) to champion in the United States an idea, human development, that is well-known internationally and has broadened the way in which we understand, measure, and track people’s well-being. This concept incorporates strictly economic metrics, like GDP, but also measures other things—besides money—that expand our choices, opportunities, and freedoms. Over the last decade, we’ve produced several national, state, and local reports, a suite of online tools, and work in the area of youth disconnection. We’ve done quite a bit of work in California over the years, producing two volumes of A Portrait of California (published in 2011 and 2014), as well as human development reports on Sonoma and Marin Counties. This report, A Portrait of LA County, builds on its predecessors and uses the same human development approach and methodology.
The concept of human development puts people at the center of analysis and considers how political, social, environmental, and economic forces interact to shape the range of choices open to us. It is the process of enlarging people’s freedoms and opportunities and improving their well-being, which is expanded or constrained by the things we do and by conditions and institutions around us, from our family situations to our neighborhoods. At its heart, human development is about what regular people can do and be in their lives. The idea draws heavily on the work of Nobel Laureate Amartya Sen, using his capabilities approach as a conceptual framework. MOA’s American Human Development Index (and UN Human Development Index upon which it is based) measures just three basic human development areas: a long and healthy life, access to knowledge, and a decent standard of living.1 People the world over generally see these areas as the three key building blocks of well-being and access to opportunity.
The portrait
A Portrait of Los Angeles County seeks to explore these questions on human development in the nation’s most populous county, and is the result of a collaboration between Measure of America and over eighty representatives from foundations, governmental, and nongovernmental institutions.2 In addition, the project had the financial support of the LA County Quality and Productivity Commission. It was the first time we had worked with such a large collection of stakeholders on a report of this nature, and the report’s content and focus on timely LA issues was immeasurably enhanced by their inputs.
In the Portrait, we presented American Human Development Index scores for:
• 106 cities and unincorporated areas in Los Angeles County
• the thirty-five community plan areas within the City of Los Angeles
• major racial and ethnic groups, as well as Asian American and Latino subgroups
• women and men
• US- and foreign-born LA County residents
Scores for the 106 cities and unincorporated areas of LA County ranged from a high of 9.43 in San Marino to a low of just 2.44 in Florence-Graham. This seven-point difference is larger than the range among the country’s 435 congressional districts. A resident of San Marino can expect to live an average eight-and-a-half years longer than a resident of Florence-Graham. Following the same pattern, a San Marino resident is sixteen times as likely to hold a bachelor’s degree, as well as have a median income of $77,948 compared to a Florence-Graham resident (with a median income of $18,405).
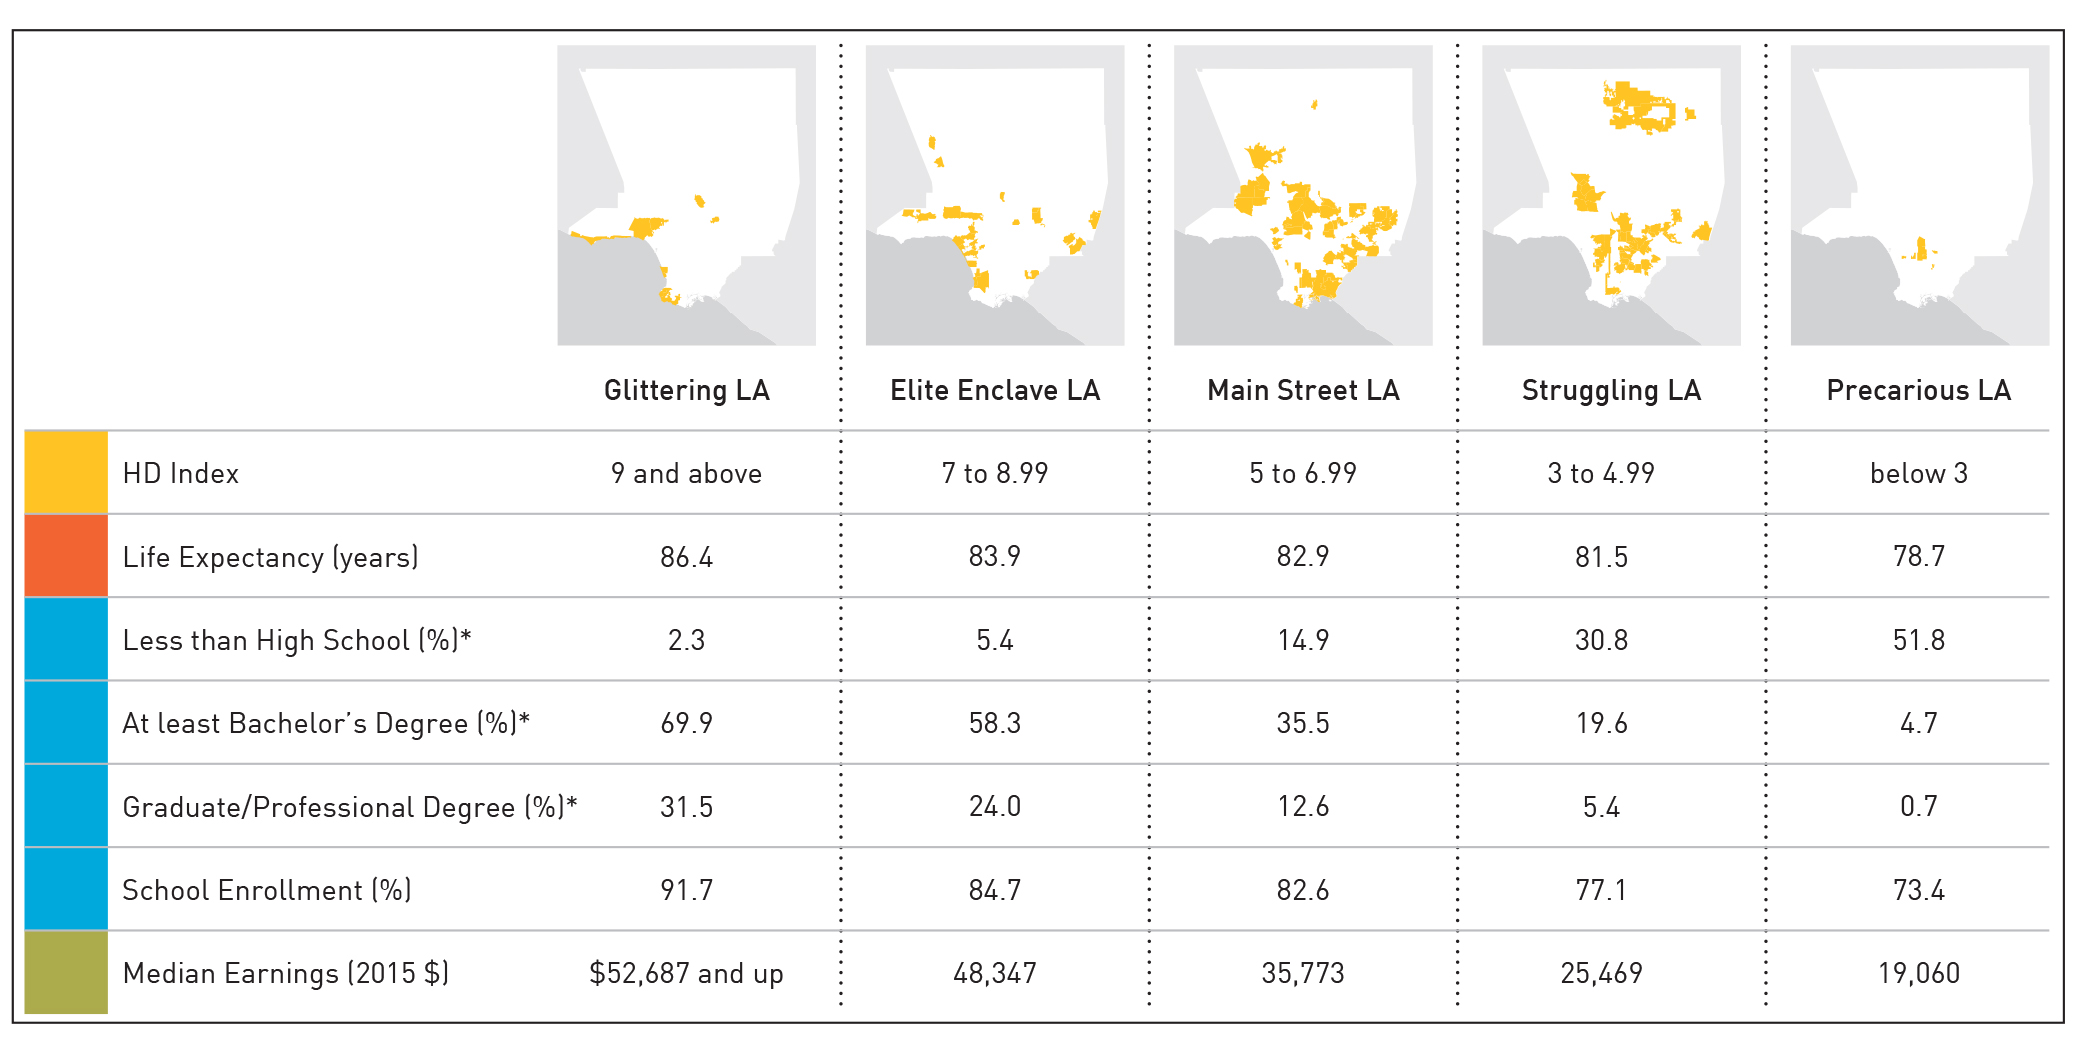
One innovative feature of the report is the “Five Los Angeles Counties” framing. The Five Los Angeles Counties were created by grouping cities and places not by geography or by the standard categorization of income, but by their scores on the 10-point American Human Development Index scale. Grouping communities according to their American Human Development Index score highlights striking differences between the different LA Counties, but also provides a useful tool for looking at what neighborhoods and cities separated by distance have in common.
Listening to the responses
Turning to the commentaries, Jennifer Lee’s book, The Asian American Achievement Paradox, was central to our understanding of educational outcomes among Asian Americans and Latinos in Los Angeles County and informs our current work for A Portrait of New York City. Lee elegantly answers the question of why Asian American children, even those of poor immigrant parents, have better educational outcomes than Latino children of immigrants in Los Angeles by drawing our attention to their wildly divergent starting positions on the educational ladder. The 1965 immigration reforms brought an influx of well-educated Asian immigrants to LA. This social capital (highly educated parents) combined with institutions and practices (like after-school and weekend learning and test-prep centers) positioned second-generation children to succeed in school, even if their parents had low incomes due to language barriers or difficulties transferring their home-country educational credentials to the United States. There was tremendous interest among our partners in data calculations and analysis about Asian subgroups with a view to looking beneath the broad Asian racial category at the strikingly different well-being outcomes within it. Using disaggregated data obtained from the California Department of Public Health and the US Census Bureau, our analysis of the ten largest subgroups revealed that Indians have the highest HD Index score (9.10) and Cambodians the lowest (5.17).
Pedro Noguera raised some concerns in his response about insufficient attention to the connections across boundaries in Los Angeles County, both geographic (between high- and low-scoring areas of the county) and sectoral (between transportation, housing, and education). One of the great strengths of the human development approach and index is a holistic framing that encourages us to look at issues in the interconnected ways in which people experience them rather than as siloed problems requiring separate solutions, and so we were surprised that this did not come out clearly in his reading. We strongly agree that both communities and sectors are interconnected, that the road to a better future runs through a deeper understanding of our shared challenges and shared fates, and that convincing “Glittering” and “Elite Enclave LA” to care about and invest in “Precarious” and “Struggling LA” is imperative to everyone’s well-being in the long run. We share Noguera’s view that, left unchecked, the county will “find itself on an unsustainable path if many of the economic and social trends identified in the report are not addressed.” We would argue that LA is already firmly on, and rather far down, that path, in fact. However, as Noguera argues, we could have made these points more forcefully and will be more explicit about them in the future.
One example of how we hope the Human Development Index will be used is the commentary of Kelly Lytle Hernandez and Terry Allen, who pair it with other data as a way to connect issues and explain the “why” behind the index score. They gathered additional data, research, and analysis on incarceration rates, trends, and policing in LA County, creating a new category, “Caged LA,” and combined their data with that on “Precarious LA” and “Struggling LA.” We are incorporating the question of incarceration and who shoulders its costs into the “Five New Yorks” framing that will be part of the upcoming A Portrait of NYC. The greater New York results are similar to the LA results, with incarceration a normalized experience in the neighborhoods of “Precarious New York” and for all practical purposes utterly absent from life in “Gilded New York” (the East Coast equivalent of “Glittering LA”). Overall, these rich commentaries remind us that while the Human Development Index score shines a light on where a community or demographic group falls on the well-being continuum, it is only the start rather than the end of the conversation.
1 The index combines a small set of indicators—life expectancy, educational degree attainment and enrollment, and median personal earnings—into a single number that falls on a scale from zero to ten, ten being the top score. We then disaggregate the population by geography and by demographic group.
2 Measure of America collaborated with fourteen local philanthropic foundations, the Southern California Grantmakers, and three Los Angeles County departments: the Office of Child Protection, the Department of Children and Family Services, and the Department of Public Health.